
 Yahoo Finance
 There Are Reasons To Feel Uneasy About RTC Group's (LON:RTC) Returns On Capital
What are the early trends we should look for to identify a stock that could multiply in value over the long term? Firstly, we'll want to see a proven return on capital employed (ROCE) that is increasing, and secondly, an expanding base of capital employed. If you see this, it typically means it's a company with a great business model and plenty of profitable reinvestment opportunities. Although, when we looked at RTC Group (LON:RTC), it didn't seem to tick all of these boxes.
Understanding Return On Capital Employed (ROCE)
For those who don't know, ROCE is a measure of a company's yearly pre-tax profit (its return), relative to the capital employed in the business. Analysts use this formula to calculate it for RTC Group:
Return on Capital Employed = Earnings Before Interest and Tax (EBIT) ÷ (Total Assets - Current Liabilities)
0.13 = UK£1.2m ÷ (UK£20m - UK£11m) (Based on the trailing twelve months to June 2023).
Thus, RTC Group has an ROCE of 13%. In isolation, that's a pretty standard return but against the Professional Services industry average of 16%, it's not as good.
Check out our latest analysis for RTC Group
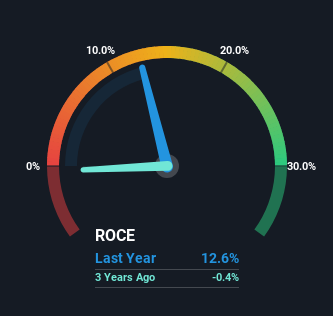
Historical performance is a great place to start when researching a stock so above you can see the gauge for RTC Group's ROCE against it's prior returns. If you'd like to look at how RTC Group has performed in the past in other metrics, you can view this free graph of past earnings, revenue and cash flow.
What The Trend Of ROCE Can Tell Us
In terms of RTC Group's historical ROCE movements, the trend isn't fantastic. To be more specific, ROCE has fallen from 32% over the last five years. Although, given both revenue and the amount of assets employed in the business have increased, it could suggest the company is investing in growth, and the extra capital has led to a short-term reduction in ROCE. If these investments prove successful, this can bode very well for long term stock performance.
On a side note, RTC Group has done well to pay down its current liabilities to 54% of total assets. So we could link some of this to the decrease in ROCE. What's more, this can reduce some aspects of risk to the business because now the company's suppliers or short-term creditors are funding less of its operations. Some would claim this reduces the business' efficiency at generating ROCE since it is now funding more of the operations with its own money. Either way, they're still at a pretty high level, so we'd like to see them fall further if possible.
The Bottom Line On RTC Group's ROCE
Even though returns on capital have fallen in the short term, we find it promising that revenue and capital employed have both increased for RTC Group. In light of this, the stock has only gained 29% over the last five years. So this stock may still be an appealing investment opportunity, if other fundamentals prove to be sound.
One more thing: We've identified 4 warning signs with RTC Group (at least 1 which is significant) , and understanding them would certainly be useful.
While RTC Group may not currently earn the highest returns, we've compiled a list of companies that currently earn more than 25% return on equity. Check out this free list here.
Have feedback on this article? Concerned about the content? Get in touch with us directly. Alternatively, email editorial-team (at) simplywallst.com.
This article by Simply Wall St is general in nature. We provide commentary based on historical data and analyst forecasts only using an unbiased methodology and our articles are not intended to be financial advice. It does not constitute a recommendation to buy or sell any stock, and does not take account of your objectives, or your financial situation. We aim to bring you long-term focused analysis driven by fundamental data. Note that our analysis may not factor in the latest price-sensitive company announcements or qualitative material. Simply Wall St has no position in any stocks mentioned.
