
 Yahoo Finance
 Reflecting on First Property Group's (LON:FPO) Share Price Returns Over The Last Three Years
In order to justify the effort of selecting individual stocks, it's worth striving to beat the returns from a market index fund. But if you try your hand at stock picking, your risk returning less than the market. Unfortunately, that's been the case for longer term First Property Group plc (LON:FPO) shareholders, since the share price is down 37% in the last three years, falling well short of the market decline of around 11%. It's up 1.5% in the last seven days.
See our latest analysis for First Property Group
There is no denying that markets are sometimes efficient, but prices do not always reflect underlying business performance. One way to examine how market sentiment has changed over time is to look at the interaction between a company's share price and its earnings per share (EPS).
During the three years that the share price fell, First Property Group's earnings per share (EPS) dropped by 28% each year. This fall in the EPS is worse than the 14% compound annual share price fall. So, despite the prior disappointment, shareholders must have some confidence the situation will improve, longer term.
The company's earnings per share (over time) is depicted in the image below (click to see the exact numbers).
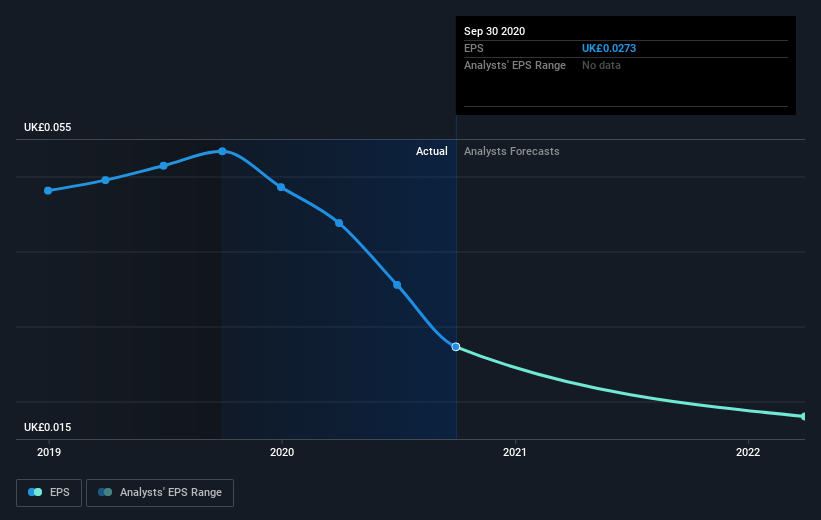
It might be well worthwhile taking a look at our free report on First Property Group's earnings, revenue and cash flow.
What About Dividends?
It is important to consider the total shareholder return, as well as the share price return, for any given stock. The TSR incorporates the value of any spin-offs or discounted capital raisings, along with any dividends, based on the assumption that the dividends are reinvested. Arguably, the TSR gives a more comprehensive picture of the return generated by a stock. In the case of First Property Group, it has a TSR of -30% for the last 3 years. That exceeds its share price return that we previously mentioned. This is largely a result of its dividend payments!
A Different Perspective
While the broader market gained around 28% in the last year, First Property Group shareholders lost 7.7% (even including dividends). Even the share prices of good stocks drop sometimes, but we want to see improvements in the fundamental metrics of a business, before getting too interested. Unfortunately, last year's performance may indicate unresolved challenges, given that it was worse than the annualised loss of 0.9% over the last half decade. We realise that Baron Rothschild has said investors should "buy when there is blood on the streets", but we caution that investors should first be sure they are buying a high quality business. While it is well worth considering the different impacts that market conditions can have on the share price, there are other factors that are even more important. Like risks, for instance. Every company has them, and we've spotted 4 warning signs for First Property Group (of which 1 is a bit unpleasant!) you should know about.
But note: First Property Group may not be the best stock to buy. So take a peek at this free list of interesting companies with past earnings growth (and further growth forecast).
Please note, the market returns quoted in this article reflect the market weighted average returns of stocks that currently trade on GB exchanges.
This article by Simply Wall St is general in nature. It does not constitute a recommendation to buy or sell any stock, and does not take account of your objectives, or your financial situation. We aim to bring you long-term focused analysis driven by fundamental data. Note that our analysis may not factor in the latest price-sensitive company announcements or qualitative material. Simply Wall St has no position in any stocks mentioned.
Have feedback on this article? Concerned about the content? Get in touch with us directly. Alternatively, email editorial-team (at) simplywallst.com.
