
 Yahoo Finance
 Reflecting on McBride's (LON:MCB) Share Price Returns Over The Last Three Years
McBride plc (LON:MCB) shareholders should be happy to see the share price up 22% in the last quarter. But that cannot eclipse the less-than-impressive returns over the last three years. In fact, the share price is down 50% in the last three years, falling well short of the market return.
View our latest analysis for McBride
In his essay The Superinvestors of Graham-and-Doddsville Warren Buffett described how share prices do not always rationally reflect the value of a business. One way to examine how market sentiment has changed over time is to look at the interaction between a company's share price and its earnings per share (EPS).
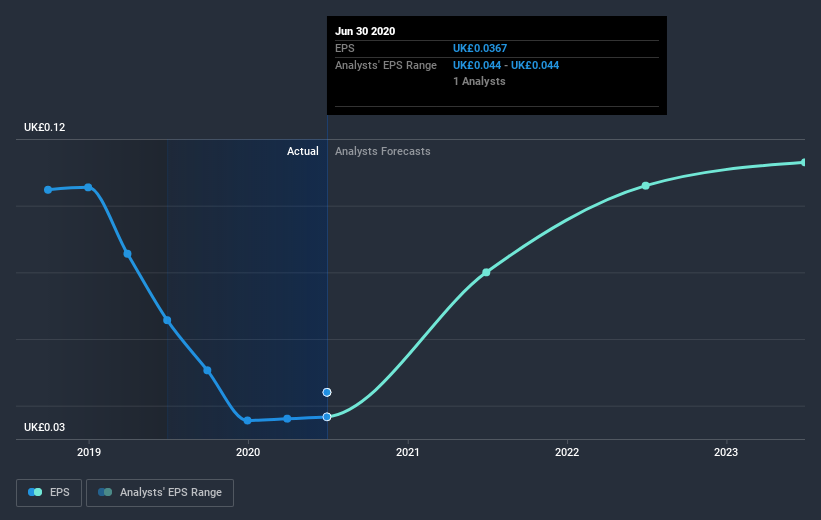
During the three years that the share price fell, McBride's earnings per share (EPS) dropped by 10% each year. The share price decline of 20% is actually steeper than the EPS slippage. So it's likely that the EPS decline has disappointed the market, leaving investors hesitant to buy.
You can see below how EPS has changed over time (discover the exact values by clicking on the image).
We like that insiders have been buying shares in the last twelve months. Having said that, most people consider earnings and revenue growth trends to be a more meaningful guide to the business. This free interactive report on McBride's earnings, revenue and cash flow is a great place to start, if you want to investigate the stock further.
A Different Perspective
It's good to see that McBride has rewarded shareholders with a total shareholder return of 20% in the last twelve months. And that does include the dividend. Notably the five-year annualised TSR loss of 8% per year compares very unfavourably with the recent share price performance. We generally put more weight on the long term performance over the short term, but the recent improvement could hint at a (positive) inflection point within the business. I find it very interesting to look at share price over the long term as a proxy for business performance. But to truly gain insight, we need to consider other information, too. Even so, be aware that McBride is showing 3 warning signs in our investment analysis , you should know about...
There are plenty of other companies that have insiders buying up shares. You probably do not want to miss this free list of growing companies that insiders are buying.
Please note, the market returns quoted in this article reflect the market weighted average returns of stocks that currently trade on GB exchanges.
This article by Simply Wall St is general in nature. It does not constitute a recommendation to buy or sell any stock, and does not take account of your objectives, or your financial situation. We aim to bring you long-term focused analysis driven by fundamental data. Note that our analysis may not factor in the latest price-sensitive company announcements or qualitative material. Simply Wall St has no position in any stocks mentioned.
Have feedback on this article? Concerned about the content? Get in touch with us directly. Alternatively, email editorial-team (at) simplywallst.com.
