
 Yahoo Finance
 Reliance's (NYSE:RS) earnings growth rate lags the 27% CAGR delivered to shareholders
It hasn't been the best quarter for Reliance, Inc. (NYSE:RS) shareholders, since the share price has fallen 14% in that time. But that scarcely detracts from the really solid long term returns generated by the company over five years. We think most investors would be happy with the 207% return, over that period. So while it's never fun to see a share price fall, it's important to look at a longer time horizon. Only time will tell if there is still too much optimism currently reflected in the share price.
While the stock has fallen 3.4% this week, it's worth focusing on the longer term and seeing if the stocks historical returns have been driven by the underlying fundamentals.
View our latest analysis for Reliance
While markets are a powerful pricing mechanism, share prices reflect investor sentiment, not just underlying business performance. By comparing earnings per share (EPS) and share price changes over time, we can get a feel for how investor attitudes to a company have morphed over time.
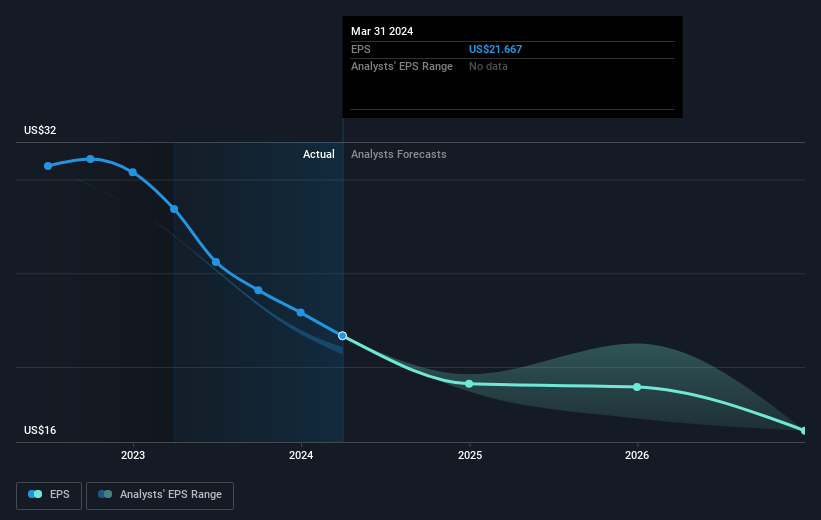
During five years of share price growth, Reliance achieved compound earnings per share (EPS) growth of 19% per year. This EPS growth is slower than the share price growth of 25% per year, over the same period. This suggests that market participants hold the company in higher regard, these days. And that's hardly shocking given the track record of growth.
You can see how EPS has changed over time in the image below (click on the chart to see the exact values).
It is of course excellent to see how Reliance has grown profits over the years, but the future is more important for shareholders. This free interactive report on Reliance's balance sheet strength is a great place to start, if you want to investigate the stock further.
What About Dividends?
It is important to consider the total shareholder return, as well as the share price return, for any given stock. The TSR is a return calculation that accounts for the value of cash dividends (assuming that any dividend received was reinvested) and the calculated value of any discounted capital raisings and spin-offs. Arguably, the TSR gives a more comprehensive picture of the return generated by a stock. In the case of Reliance, it has a TSR of 237% for the last 5 years. That exceeds its share price return that we previously mentioned. This is largely a result of its dividend payments!
A Different Perspective
Reliance shareholders gained a total return of 9.8% during the year. Unfortunately this falls short of the market return. If we look back over five years, the returns are even better, coming in at 27% per year for five years. It's quite possible the business continues to execute with prowess, even as the share price gains are slowing. I find it very interesting to look at share price over the long term as a proxy for business performance. But to truly gain insight, we need to consider other information, too. For example, we've discovered 2 warning signs for Reliance (1 is a bit unpleasant!) that you should be aware of before investing here.
If you would prefer to check out another company -- one with potentially superior financials -- then do not miss this free list of companies that have proven they can grow earnings.
Please note, the market returns quoted in this article reflect the market weighted average returns of stocks that currently trade on American exchanges.
Have feedback on this article? Concerned about the content? Get in touch with us directly. Alternatively, email editorial-team (at) simplywallst.com.
This article by Simply Wall St is general in nature. We provide commentary based on historical data and analyst forecasts only using an unbiased methodology and our articles are not intended to be financial advice. It does not constitute a recommendation to buy or sell any stock, and does not take account of your objectives, or your financial situation. We aim to bring you long-term focused analysis driven by fundamental data. Note that our analysis may not factor in the latest price-sensitive company announcements or qualitative material. Simply Wall St has no position in any stocks mentioned.
Have feedback on this article? Concerned about the content? Get in touch with us directly. Alternatively, email editorial-team@simplywallst.com
