
 Yahoo Finance
 The Return Trends At Ag Growth International (TSE:AFN) Look Promising
To find a multi-bagger stock, what are the underlying trends we should look for in a business? Ideally, a business will show two trends; firstly a growing return on capital employed (ROCE) and secondly, an increasing amount of capital employed. This shows us that it's a compounding machine, able to continually reinvest its earnings back into the business and generate higher returns. Speaking of which, we noticed some great changes in Ag Growth International's (TSE:AFN) returns on capital, so let's have a look.
What Is Return On Capital Employed (ROCE)?
For those who don't know, ROCE is a measure of a company's yearly pre-tax profit (its return), relative to the capital employed in the business. The formula for this calculation on Ag Growth International is:
Return on Capital Employed = Earnings Before Interest and Tax (EBIT) ÷ (Total Assets - Current Liabilities)
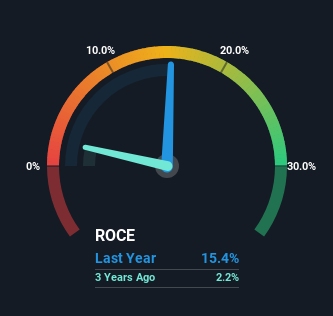
0.15 = CA$176m ÷ (CA$1.7b - CA$536m) (Based on the trailing twelve months to March 2024).
Thus, Ag Growth International has an ROCE of 15%. On its own, that's a standard return, however it's much better than the 11% generated by the Machinery industry.
Check out our latest analysis for Ag Growth International
Above you can see how the current ROCE for Ag Growth International compares to its prior returns on capital, but there's only so much you can tell from the past. If you're interested, you can view the analysts predictions in our free analyst report for Ag Growth International .
What Does the ROCE Trend For Ag Growth International Tell Us?
Ag Growth International has not disappointed with their ROCE growth. Looking at the data, we can see that even though capital employed in the business has remained relatively flat, the ROCE generated has risen by 99% over the last five years. So it's likely that the business is now reaping the full benefits of its past investments, since the capital employed hasn't changed considerably. The company is doing well in that sense, and it's worth investigating what the management team has planned for long term growth prospects.
For the record though, there was a noticeable increase in the company's current liabilities over the period, so we would attribute some of the ROCE growth to that. Essentially the business now has suppliers or short-term creditors funding about 32% of its operations, which isn't ideal. It's worth keeping an eye on this because as the percentage of current liabilities to total assets increases, some aspects of risk also increase.
What We Can Learn From Ag Growth International's ROCE
As discussed above, Ag Growth International appears to be getting more proficient at generating returns since capital employed has remained flat but earnings (before interest and tax) are up. And given the stock has remained rather flat over the last five years, there might be an opportunity here if other metrics are strong. So researching this company further and determining whether or not these trends will continue seems justified.
Since virtually every company faces some risks, it's worth knowing what they are, and we've spotted 2 warning signs for Ag Growth International (of which 1 is potentially serious!) that you should know about.
While Ag Growth International isn't earning the highest return, check out this free list of companies that are earning high returns on equity with solid balance sheets.
Have feedback on this article? Concerned about the content? Get in touch with us directly. Alternatively, email editorial-team (at) simplywallst.com.
This article by Simply Wall St is general in nature. We provide commentary based on historical data and analyst forecasts only using an unbiased methodology and our articles are not intended to be financial advice. It does not constitute a recommendation to buy or sell any stock, and does not take account of your objectives, or your financial situation. We aim to bring you long-term focused analysis driven by fundamental data. Note that our analysis may not factor in the latest price-sensitive company announcements or qualitative material. Simply Wall St has no position in any stocks mentioned.
