
 Yahoo Finance
 The Return Trends At Casey's General Stores (NASDAQ:CASY) Look Promising
Did you know there are some financial metrics that can provide clues of a potential multi-bagger? Ideally, a business will show two trends; firstly a growing return on capital employed (ROCE) and secondly, an increasing amount of capital employed. Ultimately, this demonstrates that it's a business that is reinvesting profits at increasing rates of return. So when we looked at Casey's General Stores (NASDAQ:CASY) and its trend of ROCE, we really liked what we saw.
Understanding Return On Capital Employed (ROCE)
Just to clarify if you're unsure, ROCE is a metric for evaluating how much pre-tax income (in percentage terms) a company earns on the capital invested in its business. The formula for this calculation on Casey's General Stores is:
Return on Capital Employed = Earnings Before Interest and Tax (EBIT) ÷ (Total Assets - Current Liabilities)
0.13 = US$723m ÷ (US$6.3b - US$953m) (Based on the trailing twelve months to April 2024).
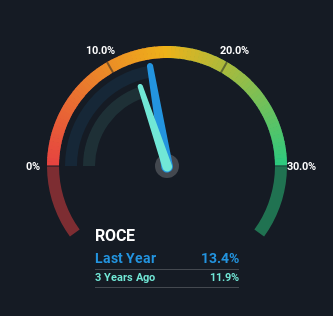
Therefore, Casey's General Stores has an ROCE of 13%. In absolute terms, that's a satisfactory return, but compared to the Consumer Retailing industry average of 10% it's much better.
Check out our latest analysis for Casey's General Stores
Above you can see how the current ROCE for Casey's General Stores compares to its prior returns on capital, but there's only so much you can tell from the past. If you'd like, you can check out the forecasts from the analysts covering Casey's General Stores for free.
So How Is Casey's General Stores' ROCE Trending?
Investors would be pleased with what's happening at Casey's General Stores. The numbers show that in the last five years, the returns generated on capital employed have grown considerably to 13%. Basically the business is earning more per dollar of capital invested and in addition to that, 72% more capital is being employed now too. The increasing returns on a growing amount of capital is common amongst multi-baggers and that's why we're impressed.
The Key Takeaway
In summary, it's great to see that Casey's General Stores can compound returns by consistently reinvesting capital at increasing rates of return, because these are some of the key ingredients of those highly sought after multi-baggers. Since the stock has returned a staggering 151% to shareholders over the last five years, it looks like investors are recognizing these changes. With that being said, we still think the promising fundamentals mean the company deserves some further due diligence.
If you want to continue researching Casey's General Stores, you might be interested to know about the 1 warning sign that our analysis has discovered.
If you want to search for solid companies with great earnings, check out this free list of companies with good balance sheets and impressive returns on equity.
Have feedback on this article? Concerned about the content? Get in touch with us directly. Alternatively, email editorial-team (at) simplywallst.com.
This article by Simply Wall St is general in nature. We provide commentary based on historical data and analyst forecasts only using an unbiased methodology and our articles are not intended to be financial advice. It does not constitute a recommendation to buy or sell any stock, and does not take account of your objectives, or your financial situation. We aim to bring you long-term focused analysis driven by fundamental data. Note that our analysis may not factor in the latest price-sensitive company announcements or qualitative material. Simply Wall St has no position in any stocks mentioned.
Have feedback on this article? Concerned about the content? Get in touch with us directly. Alternatively, email editorial-team@simplywallst.com
