
 Yahoo Finance
 The Return Trends At Dycom Industries (NYSE:DY) Look Promising
If you're looking for a multi-bagger, there's a few things to keep an eye out for. In a perfect world, we'd like to see a company investing more capital into its business and ideally the returns earned from that capital are also increasing. Ultimately, this demonstrates that it's a business that is reinvesting profits at increasing rates of return. Speaking of which, we noticed some great changes in Dycom Industries' (NYSE:DY) returns on capital, so let's have a look.
Understanding Return On Capital Employed (ROCE)
For those who don't know, ROCE is a measure of a company's yearly pre-tax profit (its return), relative to the capital employed in the business. The formula for this calculation on Dycom Industries is:
Return on Capital Employed = Earnings Before Interest and Tax (EBIT) ÷ (Total Assets - Current Liabilities)
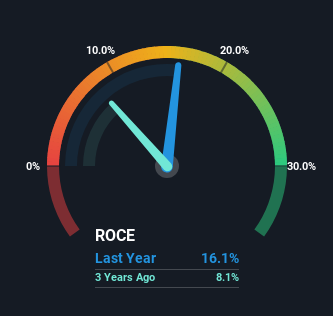
0.16 = US$323m ÷ (US$2.5b - US$506m) (Based on the trailing twelve months to January 2024).
Thus, Dycom Industries has an ROCE of 16%. On its own, that's a standard return, however it's much better than the 13% generated by the Construction industry.
View our latest analysis for Dycom Industries
In the above chart we have measured Dycom Industries' prior ROCE against its prior performance, but the future is arguably more important. If you'd like, you can check out the forecasts from the analysts covering Dycom Industries for free.
What Does the ROCE Trend For Dycom Industries Tell Us?
Dycom Industries' ROCE growth is quite impressive. Looking at the data, we can see that even though capital employed in the business has remained relatively flat, the ROCE generated has risen by 150% over the last five years. Basically the business is generating higher returns from the same amount of capital and that is proof that there are improvements in the company's efficiencies. The company is doing well in that sense, and it's worth investigating what the management team has planned for long term growth prospects.
The Key Takeaway
To bring it all together, Dycom Industries has done well to increase the returns it's generating from its capital employed. Since the stock has returned a staggering 178% to shareholders over the last five years, it looks like investors are recognizing these changes. With that being said, we still think the promising fundamentals mean the company deserves some further due diligence.
On a separate note, we've found 1 warning sign for Dycom Industries you'll probably want to know about.
While Dycom Industries isn't earning the highest return, check out this free list of companies that are earning high returns on equity with solid balance sheets.
Have feedback on this article? Concerned about the content? Get in touch with us directly. Alternatively, email editorial-team (at) simplywallst.com.
This article by Simply Wall St is general in nature. We provide commentary based on historical data and analyst forecasts only using an unbiased methodology and our articles are not intended to be financial advice. It does not constitute a recommendation to buy or sell any stock, and does not take account of your objectives, or your financial situation. We aim to bring you long-term focused analysis driven by fundamental data. Note that our analysis may not factor in the latest price-sensitive company announcements or qualitative material. Simply Wall St has no position in any stocks mentioned.
