
 Yahoo Finance
 The Return Trends At Royal Caribbean Cruises (NYSE:RCL) Look Promising
If we want to find a potential multi-bagger, often there are underlying trends that can provide clues. Firstly, we'd want to identify a growing return on capital employed (ROCE) and then alongside that, an ever-increasing base of capital employed. Ultimately, this demonstrates that it's a business that is reinvesting profits at increasing rates of return. So when we looked at Royal Caribbean Cruises (NYSE:RCL) and its trend of ROCE, we really liked what we saw.
What Is Return On Capital Employed (ROCE)?
For those who don't know, ROCE is a measure of a company's yearly pre-tax profit (its return), relative to the capital employed in the business. To calculate this metric for Royal Caribbean Cruises, this is the formula:
Return on Capital Employed = Earnings Before Interest and Tax (EBIT) ÷ (Total Assets - Current Liabilities)
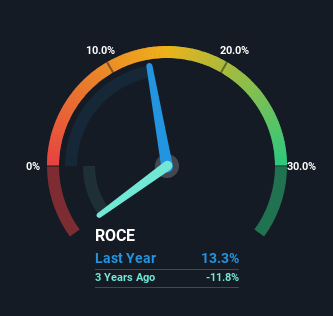
0.13 = US$3.4b ÷ (US$35b - US$9.9b) (Based on the trailing twelve months to March 2024).
So, Royal Caribbean Cruises has an ROCE of 13%. In absolute terms, that's a satisfactory return, but compared to the Hospitality industry average of 10% it's much better.
Check out our latest analysis for Royal Caribbean Cruises
Above you can see how the current ROCE for Royal Caribbean Cruises compares to its prior returns on capital, but there's only so much you can tell from the past. If you'd like to see what analysts are forecasting going forward, you should check out our free analyst report for Royal Caribbean Cruises .
How Are Returns Trending?
Investors would be pleased with what's happening at Royal Caribbean Cruises. Over the last five years, returns on capital employed have risen substantially to 13%. Basically the business is earning more per dollar of capital invested and in addition to that, 23% more capital is being employed now too. This can indicate that there's plenty of opportunities to invest capital internally and at ever higher rates, a combination that's common among multi-baggers.
The Bottom Line
In summary, it's great to see that Royal Caribbean Cruises can compound returns by consistently reinvesting capital at increasing rates of return, because these are some of the key ingredients of those highly sought after multi-baggers. And with a respectable 41% awarded to those who held the stock over the last five years, you could argue that these developments are starting to get the attention they deserve. With that being said, we still think the promising fundamentals mean the company deserves some further due diligence.
One more thing: We've identified 2 warning signs with Royal Caribbean Cruises (at least 1 which makes us a bit uncomfortable) , and understanding these would certainly be useful.
While Royal Caribbean Cruises may not currently earn the highest returns, we've compiled a list of companies that currently earn more than 25% return on equity. Check out this free list here.
Have feedback on this article? Concerned about the content? Get in touch with us directly. Alternatively, email editorial-team (at) simplywallst.com.
This article by Simply Wall St is general in nature. We provide commentary based on historical data and analyst forecasts only using an unbiased methodology and our articles are not intended to be financial advice. It does not constitute a recommendation to buy or sell any stock, and does not take account of your objectives, or your financial situation. We aim to bring you long-term focused analysis driven by fundamental data. Note that our analysis may not factor in the latest price-sensitive company announcements or qualitative material. Simply Wall St has no position in any stocks mentioned.
Have feedback on this article? Concerned about the content? Get in touch with us directly. Alternatively, email editorial-team@simplywallst.com
