
 Yahoo Finance
 The Return Trends At Titan International (NYSE:TWI) Look Promising
If we want to find a potential multi-bagger, often there are underlying trends that can provide clues. Typically, we'll want to notice a trend of growing return on capital employed (ROCE) and alongside that, an expanding base of capital employed. Basically this means that a company has profitable initiatives that it can continue to reinvest in, which is a trait of a compounding machine. With that in mind, we've noticed some promising trends at Titan International (NYSE:TWI) so let's look a bit deeper.
Return On Capital Employed (ROCE): What Is It?
For those that aren't sure what ROCE is, it measures the amount of pre-tax profits a company can generate from the capital employed in its business. The formula for this calculation on Titan International is:
Return on Capital Employed = Earnings Before Interest and Tax (EBIT) ÷ (Total Assets - Current Liabilities)
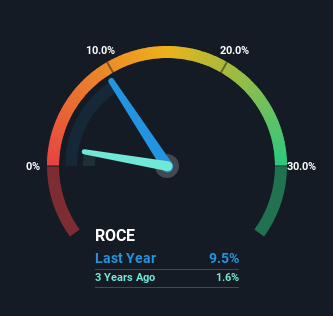
0.095 = US$125m ÷ (US$1.8b - US$495m) (Based on the trailing twelve months to March 2024).
So, Titan International has an ROCE of 9.5%. Ultimately, that's a low return and it under-performs the Machinery industry average of 13%.
View our latest analysis for Titan International
Above you can see how the current ROCE for Titan International compares to its prior returns on capital, but there's only so much you can tell from the past. If you'd like to see what analysts are forecasting going forward, you should check out our free analyst report for Titan International .
What Can We Tell From Titan International's ROCE Trend?
Even though ROCE is still low in absolute terms, it's good to see it's heading in the right direction. Over the last five years, returns on capital employed have risen substantially to 9.5%. The company is effectively making more money per dollar of capital used, and it's worth noting that the amount of capital has increased too, by 49%. The increasing returns on a growing amount of capital is common amongst multi-baggers and that's why we're impressed.
The Key Takeaway
All in all, it's terrific to see that Titan International is reaping the rewards from prior investments and is growing its capital base. And with a respectable 61% awarded to those who held the stock over the last five years, you could argue that these developments are starting to get the attention they deserve. Therefore, we think it would be worth your time to check if these trends are going to continue.
One more thing, we've spotted 3 warning signs facing Titan International that you might find interesting.
For those who like to invest in solid companies, check out this free list of companies with solid balance sheets and high returns on equity.
Have feedback on this article? Concerned about the content? Get in touch with us directly. Alternatively, email editorial-team (at) simplywallst.com.
This article by Simply Wall St is general in nature. We provide commentary based on historical data and analyst forecasts only using an unbiased methodology and our articles are not intended to be financial advice. It does not constitute a recommendation to buy or sell any stock, and does not take account of your objectives, or your financial situation. We aim to bring you long-term focused analysis driven by fundamental data. Note that our analysis may not factor in the latest price-sensitive company announcements or qualitative material. Simply Wall St has no position in any stocks mentioned.
Have feedback on this article? Concerned about the content? Get in touch with us directly. Alternatively, email editorial-team@simplywallst.com
