
 Yahoo Finance
 The Returns At Boyd Group Services (TSE:BYD) Aren't Growing
To find a multi-bagger stock, what are the underlying trends we should look for in a business? In a perfect world, we'd like to see a company investing more capital into its business and ideally the returns earned from that capital are also increasing. Basically this means that a company has profitable initiatives that it can continue to reinvest in, which is a trait of a compounding machine. Having said that, from a first glance at Boyd Group Services (TSE:BYD) we aren't jumping out of our chairs at how returns are trending, but let's have a deeper look.
Return On Capital Employed (ROCE): What Is It?
If you haven't worked with ROCE before, it measures the 'return' (pre-tax profit) a company generates from capital employed in its business. The formula for this calculation on Boyd Group Services is:
Return on Capital Employed = Earnings Before Interest and Tax (EBIT) ÷ (Total Assets - Current Liabilities)
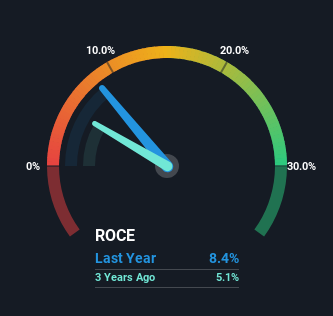
0.084 = US$164m ÷ (US$2.4b - US$459m) (Based on the trailing twelve months to March 2024).
So, Boyd Group Services has an ROCE of 8.4%. Even though it's in line with the industry average of 8.4%, it's still a low return by itself.
See our latest analysis for Boyd Group Services
In the above chart we have measured Boyd Group Services' prior ROCE against its prior performance, but the future is arguably more important. If you'd like, you can check out the forecasts from the analysts covering Boyd Group Services for free.
What Does the ROCE Trend For Boyd Group Services Tell Us?
In terms of Boyd Group Services' historical ROCE trend, it doesn't exactly demand attention. Over the past five years, ROCE has remained relatively flat at around 8.4% and the business has deployed 88% more capital into its operations. This poor ROCE doesn't inspire confidence right now, and with the increase in capital employed, it's evident that the business isn't deploying the funds into high return investments.
Our Take On Boyd Group Services' ROCE
As we've seen above, Boyd Group Services' returns on capital haven't increased but it is reinvesting in the business. Although the market must be expecting these trends to improve because the stock has gained 54% over the last five years. Ultimately, if the underlying trends persist, we wouldn't hold our breath on it being a multi-bagger going forward.
On a final note, we've found 1 warning sign for Boyd Group Services that we think you should be aware of.
If you want to search for solid companies with great earnings, check out this free list of companies with good balance sheets and impressive returns on equity.
Have feedback on this article? Concerned about the content? Get in touch with us directly. Alternatively, email editorial-team (at) simplywallst.com.
This article by Simply Wall St is general in nature. We provide commentary based on historical data and analyst forecasts only using an unbiased methodology and our articles are not intended to be financial advice. It does not constitute a recommendation to buy or sell any stock, and does not take account of your objectives, or your financial situation. We aim to bring you long-term focused analysis driven by fundamental data. Note that our analysis may not factor in the latest price-sensitive company announcements or qualitative material. Simply Wall St has no position in any stocks mentioned.
Have feedback on this article? Concerned about the content? Get in touch with us directly. Alternatively, email editorial-team@simplywallst.com
