
 Yahoo Finance
 The Returns At Britvic (LON:BVIC) Provide Us With Signs Of What's To Come

Did you know there are some financial metrics that can provide clues of a potential multi-bagger? In a perfect world, we'd like to see a company investing more capital into its business and ideally the returns earned from that capital are also increasing. This shows us that it's a compounding machine, able to continually reinvest its earnings back into the business and generate higher returns. Having said that, from a first glance at Britvic (LON:BVIC) we aren't jumping out of our chairs at how returns are trending, but let's have a deeper look.
What is Return On Capital Employed (ROCE)?
For those who don't know, ROCE is a measure of a company's yearly pre-tax profit (its return), relative to the capital employed in the business. To calculate this metric for Britvic, this is the formula:
Return on Capital Employed = Earnings Before Interest and Tax (EBIT) ÷ (Total Assets - Current Liabilities)
0.15 = UK£154m ÷ (UK£1.8b - UK£777m) (Based on the trailing twelve months to March 2020).
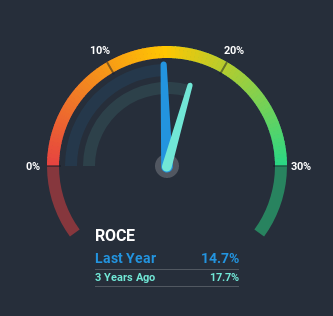
So, Britvic has an ROCE of 15%. That's a relatively normal return on capital, and it's around the 12% generated by the Beverage industry.
See our latest analysis for Britvic
Above you can see how the current ROCE for Britvic compares to its prior returns on capital, but there's only so much you can tell from the past. If you're interested, you can view the analysts predictions in our free report on analyst forecasts for the company.
So How Is Britvic's ROCE Trending?
When we looked at the ROCE trend at Britvic, we didn't gain much confidence. Around five years ago the returns on capital were 24%, but since then they've fallen to 15%. On the other hand, the company has been employing more capital without a corresponding improvement in sales in the last year, which could suggest these investments are longer term plays. It's worth keeping an eye on the company's earnings from here on to see if these investments do end up contributing to the bottom line.
Another thing to note, Britvic has a high ratio of current liabilities to total assets of 43%. This effectively means that suppliers (or short-term creditors) are funding a large portion of the business, so just be aware that this can introduce some elements of risk. Ideally we'd like to see this reduce as that would mean fewer obligations bearing risks.
The Bottom Line On Britvic's ROCE
In summary, Britvic is reinvesting funds back into the business for growth but unfortunately it looks like sales haven't increased much just yet. And with the stock having returned a mere 32% in the last five years to shareholders, you could argue that they're aware of these lackluster trends. So if you're looking for a multi-bagger, the underlying trends indicate you may have better chances elsewhere.
On a final note, we've found 1 warning sign for Britvic that we think you should be aware of.
If you want to search for solid companies with great earnings, check out this free list of companies with good balance sheets and impressive returns on equity.
This article by Simply Wall St is general in nature. It does not constitute a recommendation to buy or sell any stock, and does not take account of your objectives, or your financial situation. We aim to bring you long-term focused analysis driven by fundamental data. Note that our analysis may not factor in the latest price-sensitive company announcements or qualitative material. Simply Wall St has no position in any stocks mentioned.
Have feedback on this article? Concerned about the content? Get in touch with us directly. Alternatively, email editorial-team@simplywallst.com.
