
 Yahoo Finance
 The Returns On Capital At Advanced Medical Solutions Group (LON:AMS) Don't Inspire Confidence
Finding a business that has the potential to grow substantially is not easy, but it is possible if we look at a few key financial metrics. Amongst other things, we'll want to see two things; firstly, a growing return on capital employed (ROCE) and secondly, an expansion in the company's amount of capital employed. This shows us that it's a compounding machine, able to continually reinvest its earnings back into the business and generate higher returns. However, after briefly looking over the numbers, we don't think Advanced Medical Solutions Group (LON:AMS) has the makings of a multi-bagger going forward, but let's have a look at why that may be.
Return On Capital Employed (ROCE): What Is It?
For those that aren't sure what ROCE is, it measures the amount of pre-tax profits a company can generate from the capital employed in its business. To calculate this metric for Advanced Medical Solutions Group, this is the formula:
Return on Capital Employed = Earnings Before Interest and Tax (EBIT) ÷ (Total Assets - Current Liabilities)
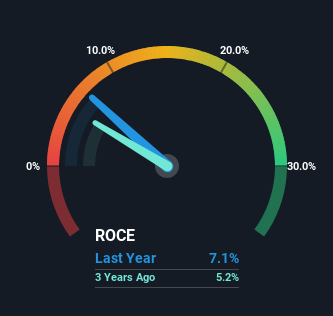
0.071 = UK£19m ÷ (UK£289m - UK£22m) (Based on the trailing twelve months to December 2023).
Thus, Advanced Medical Solutions Group has an ROCE of 7.1%. Ultimately, that's a low return and it under-performs the Medical Equipment industry average of 8.8%.
View our latest analysis for Advanced Medical Solutions Group
In the above chart we have measured Advanced Medical Solutions Group's prior ROCE against its prior performance, but the future is arguably more important. If you'd like, you can check out the forecasts from the analysts covering Advanced Medical Solutions Group for free.
How Are Returns Trending?
When we looked at the ROCE trend at Advanced Medical Solutions Group, we didn't gain much confidence. Around five years ago the returns on capital were 16%, but since then they've fallen to 7.1%. However it looks like Advanced Medical Solutions Group might be reinvesting for long term growth because while capital employed has increased, the company's sales haven't changed much in the last 12 months. It may take some time before the company starts to see any change in earnings from these investments.
The Bottom Line On Advanced Medical Solutions Group's ROCE
In summary, Advanced Medical Solutions Group is reinvesting funds back into the business for growth but unfortunately it looks like sales haven't increased much just yet. Since the stock has declined 37% over the last five years, investors may not be too optimistic on this trend improving either. On the whole, we aren't too inspired by the underlying trends and we think there may be better chances of finding a multi-bagger elsewhere.
If you're still interested in Advanced Medical Solutions Group it's worth checking out our FREE intrinsic value approximation for AMS to see if it's trading at an attractive price in other respects.
While Advanced Medical Solutions Group may not currently earn the highest returns, we've compiled a list of companies that currently earn more than 25% return on equity. Check out this free list here.
Have feedback on this article? Concerned about the content? Get in touch with us directly. Alternatively, email editorial-team (at) simplywallst.com.
This article by Simply Wall St is general in nature. We provide commentary based on historical data and analyst forecasts only using an unbiased methodology and our articles are not intended to be financial advice. It does not constitute a recommendation to buy or sell any stock, and does not take account of your objectives, or your financial situation. We aim to bring you long-term focused analysis driven by fundamental data. Note that our analysis may not factor in the latest price-sensitive company announcements or qualitative material. Simply Wall St has no position in any stocks mentioned.
