
 Yahoo Finance
 Returns On Capital At Iridium Communications (NASDAQ:IRDM) Paint A Concerning Picture
When we're researching a company, it's sometimes hard to find the warning signs, but there are some financial metrics that can help spot trouble early. When we see a declining return on capital employed (ROCE) in conjunction with a declining base of capital employed, that's often how a mature business shows signs of aging. This indicates the company is producing less profit from its investments and its total assets are decreasing. On that note, looking into Iridium Communications (NASDAQ:IRDM), we weren't too upbeat about how things were going.
What Is Return On Capital Employed (ROCE)?
For those that aren't sure what ROCE is, it measures the amount of pre-tax profits a company can generate from the capital employed in its business. The formula for this calculation on Iridium Communications is:
Return on Capital Employed = Earnings Before Interest and Tax (EBIT) ÷ (Total Assets - Current Liabilities)
0.023 = US$69m ÷ (US$3.1b - US$127m) (Based on the trailing twelve months to September 2022).
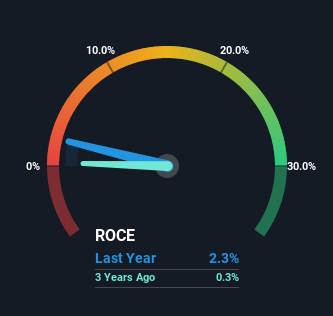
So, Iridium Communications has an ROCE of 2.3%. In absolute terms, that's a low return and it also under-performs the Telecom industry average of 8.1%.
View our latest analysis for Iridium Communications
Above you can see how the current ROCE for Iridium Communications compares to its prior returns on capital, but there's only so much you can tell from the past. If you'd like to see what analysts are forecasting going forward, you should check out our free report for Iridium Communications.
So How Is Iridium Communications' ROCE Trending?
There is reason to be cautious about Iridium Communications, given the returns are trending downwards. Unfortunately the returns on capital have diminished from the 4.3% that they were earning five years ago. Meanwhile, capital employed in the business has stayed roughly the flat over the period. Companies that exhibit these attributes tend to not be shrinking, but they can be mature and facing pressure on their margins from competition. So because these trends aren't typically conducive to creating a multi-bagger, we wouldn't hold our breath on Iridium Communications becoming one if things continue as they have.
The Bottom Line
In the end, the trend of lower returns on the same amount of capital isn't typically an indication that we're looking at a growth stock. Since the stock has skyrocketed 334% over the last five years, it looks like investors have high expectations of the stock. Regardless, we don't feel too comfortable with the fundamentals so we'd be steering clear of this stock for now.
On a final note, we've found 1 warning sign for Iridium Communications that we think you should be aware of.
For those who like to invest in solid companies, check out this free list of companies with solid balance sheets and high returns on equity.
Have feedback on this article? Concerned about the content? Get in touch with us directly. Alternatively, email editorial-team (at) simplywallst.com.
This article by Simply Wall St is general in nature. We provide commentary based on historical data and analyst forecasts only using an unbiased methodology and our articles are not intended to be financial advice. It does not constitute a recommendation to buy or sell any stock, and does not take account of your objectives, or your financial situation. We aim to bring you long-term focused analysis driven by fundamental data. Note that our analysis may not factor in the latest price-sensitive company announcements or qualitative material. Simply Wall St has no position in any stocks mentioned.
Join A Paid User Research Session
You’ll receive a US$30 Amazon Gift card for 1 hour of your time while helping us build better investing tools for the individual investors like yourself. Sign up here
