
 Yahoo Finance
 Returns On Capital At MS INTERNATIONAL (LON:MSI) Have Stalled
To find a multi-bagger stock, what are the underlying trends we should look for in a business? Typically, we'll want to notice a trend of growing return on capital employed (ROCE) and alongside that, an expanding base of capital employed. This shows us that it's a compounding machine, able to continually reinvest its earnings back into the business and generate higher returns. So, when we ran our eye over MS INTERNATIONAL's (LON:MSI) trend of ROCE, we liked what we saw.
Understanding Return On Capital Employed (ROCE)
For those that aren't sure what ROCE is, it measures the amount of pre-tax profits a company can generate from the capital employed in its business. Analysts use this formula to calculate it for MS INTERNATIONAL:
Return on Capital Employed = Earnings Before Interest and Tax (EBIT) ÷ (Total Assets - Current Liabilities)
0.14 = UK£9.8m ÷ (UK£128m - UK£58m) (Based on the trailing twelve months to October 2023).
Thus, MS INTERNATIONAL has an ROCE of 14%. That's a relatively normal return on capital, and it's around the 12% generated by the Aerospace & Defense industry.
See our latest analysis for MS INTERNATIONAL
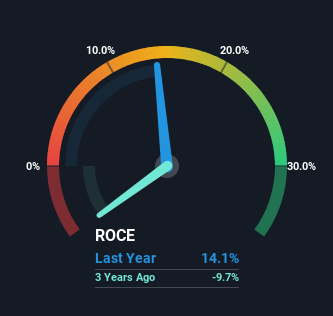
Historical performance is a great place to start when researching a stock so above you can see the gauge for MS INTERNATIONAL's ROCE against it's prior returns. If you want to delve into the historical earnings , check out these free graphs detailing revenue and cash flow performance of MS INTERNATIONAL.
How Are Returns Trending?
The trend of ROCE doesn't stand out much, but returns on a whole are decent. The company has employed 65% more capital in the last five years, and the returns on that capital have remained stable at 14%. 14% is a pretty standard return, and it provides some comfort knowing that MS INTERNATIONAL has consistently earned this amount. Stable returns in this ballpark can be unexciting, but if they can be maintained over the long run, they often provide nice rewards to shareholders.
On a separate but related note, it's important to know that MS INTERNATIONAL has a current liabilities to total assets ratio of 46%, which we'd consider pretty high. This effectively means that suppliers (or short-term creditors) are funding a large portion of the business, so just be aware that this can introduce some elements of risk. Ideally we'd like to see this reduce as that would mean fewer obligations bearing risks.
What We Can Learn From MS INTERNATIONAL's ROCE
In the end, MS INTERNATIONAL has proven its ability to adequately reinvest capital at good rates of return. On top of that, the stock has rewarded shareholders with a remarkable 362% return to those who've held over the last five years. So while the positive underlying trends may be accounted for by investors, we still think this stock is worth looking into further.
One more thing to note, we've identified 1 warning sign with MS INTERNATIONAL and understanding this should be part of your investment process.
If you want to search for solid companies with great earnings, check out this free list of companies with good balance sheets and impressive returns on equity.
Have feedback on this article? Concerned about the content? Get in touch with us directly. Alternatively, email editorial-team (at) simplywallst.com.
This article by Simply Wall St is general in nature. We provide commentary based on historical data and analyst forecasts only using an unbiased methodology and our articles are not intended to be financial advice. It does not constitute a recommendation to buy or sell any stock, and does not take account of your objectives, or your financial situation. We aim to bring you long-term focused analysis driven by fundamental data. Note that our analysis may not factor in the latest price-sensitive company announcements or qualitative material. Simply Wall St has no position in any stocks mentioned.
