
 Yahoo Finance
 Returns on Capital Paint A Bright Future For Gartner (NYSE:IT)
If we want to find a stock that could multiply over the long term, what are the underlying trends we should look for? Typically, we'll want to notice a trend of growing return on capital employed (ROCE) and alongside that, an expanding base of capital employed. Basically this means that a company has profitable initiatives that it can continue to reinvest in, which is a trait of a compounding machine. Speaking of which, we noticed some great changes in Gartner's (NYSE:IT) returns on capital, so let's have a look.
What is Return On Capital Employed (ROCE)?
Just to clarify if you're unsure, ROCE is a metric for evaluating how much pre-tax income (in percentage terms) a company earns on the capital invested in its business. The formula for this calculation on Gartner is:
Return on Capital Employed = Earnings Before Interest and Tax (EBIT) ÷ (Total Assets - Current Liabilities)
0.27 = US$988m ÷ (US$7.0b - US$3.3b) (Based on the trailing twelve months to March 2022).
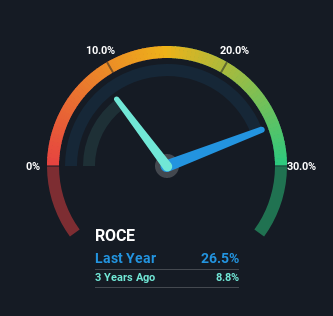
So, Gartner has an ROCE of 27%. In absolute terms that's a great return and it's even better than the IT industry average of 12%.
Check out our latest analysis for Gartner
Above you can see how the current ROCE for Gartner compares to its prior returns on capital, but there's only so much you can tell from the past. If you'd like, you can check out the forecasts from the analysts covering Gartner here for free.
How Are Returns Trending?
Gartner is displaying some positive trends. Over the last five years, returns on capital employed have risen substantially to 27%. Basically the business is earning more per dollar of capital invested and in addition to that, 93% more capital is being employed now too. So we're very much inspired by what we're seeing at Gartner thanks to its ability to profitably reinvest capital.
On a side note, Gartner's current liabilities are still rather high at 47% of total assets. This can bring about some risks because the company is basically operating with a rather large reliance on its suppliers or other sorts of short-term creditors. Ideally we'd like to see this reduce as that would mean fewer obligations bearing risks.
The Bottom Line On Gartner's ROCE
To sum it up, Gartner has proven it can reinvest in the business and generate higher returns on that capital employed, which is terrific. And a remarkable 125% total return over the last five years tells us that investors are expecting more good things to come in the future. Therefore, we think it would be worth your time to check if these trends are going to continue.
Since virtually every company faces some risks, it's worth knowing what they are, and we've spotted 3 warning signs for Gartner (of which 1 is a bit unpleasant!) that you should know about.
If you'd like to see other companies earning high returns, check out our free list of companies earning high returns with solid balance sheets here.
Have feedback on this article? Concerned about the content? Get in touch with us directly. Alternatively, email editorial-team (at) simplywallst.com.
This article by Simply Wall St is general in nature. We provide commentary based on historical data and analyst forecasts only using an unbiased methodology and our articles are not intended to be financial advice. It does not constitute a recommendation to buy or sell any stock, and does not take account of your objectives, or your financial situation. We aim to bring you long-term focused analysis driven by fundamental data. Note that our analysis may not factor in the latest price-sensitive company announcements or qualitative material. Simply Wall St has no position in any stocks mentioned.
