
 Yahoo Finance
 Returns On Capital Are Showing Encouraging Signs At Park & Bellheimer (FRA:PKB)
If we want to find a stock that could multiply over the long term, what are the underlying trends we should look for? Ideally, a business will show two trends; firstly a growing return on capital employed (ROCE) and secondly, an increasing amount of capital employed. Ultimately, this demonstrates that it's a business that is reinvesting profits at increasing rates of return. With that in mind, we've noticed some promising trends at Park & Bellheimer (FRA:PKB) so let's look a bit deeper.
Return On Capital Employed (ROCE): What Is It?
For those who don't know, ROCE is a measure of a company's yearly pre-tax profit (its return), relative to the capital employed in the business. The formula for this calculation on Park & Bellheimer is:
Return on Capital Employed = Earnings Before Interest and Tax (EBIT) ÷ (Total Assets - Current Liabilities)
0.10 = €2.3m ÷ (€38m - €15m) (Based on the trailing twelve months to June 2023).
So, Park & Bellheimer has an ROCE of 10.0%. In absolute terms, that's a low return, but it's much better than the Beverage industry average of 6.4%.
View our latest analysis for Park & Bellheimer
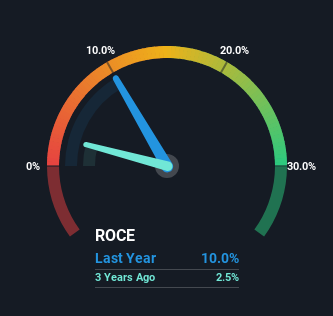
Historical performance is a great place to start when researching a stock so above you can see the gauge for Park & Bellheimer's ROCE against it's prior returns. If you'd like to look at how Park & Bellheimer has performed in the past in other metrics, you can view this free graph of Park & Bellheimer's past earnings, revenue and cash flow.
What Can We Tell From Park & Bellheimer's ROCE Trend?
Park & Bellheimer's ROCE growth is quite impressive. Looking at the data, we can see that even though capital employed in the business has remained relatively flat, the ROCE generated has risen by 192% over the last five years. Basically the business is generating higher returns from the same amount of capital and that is proof that there are improvements in the company's efficiencies. It's worth looking deeper into this though because while it's great that the business is more efficient, it might also mean that going forward the areas to invest internally for the organic growth are lacking.
For the record though, there was a noticeable increase in the company's current liabilities over the period, so we would attribute some of the ROCE growth to that. The current liabilities has increased to 39% of total assets, so the business is now more funded by the likes of its suppliers or short-term creditors. Keep an eye out for future increases because when the ratio of current liabilities to total assets gets particularly high, this can introduce some new risks for the business.
The Bottom Line
In summary, we're delighted to see that Park & Bellheimer has been able to increase efficiencies and earn higher rates of return on the same amount of capital. Considering the stock has delivered 29% to its stockholders over the last five years, it may be fair to think that investors aren't fully aware of the promising trends yet. So exploring more about this stock could uncover a good opportunity, if the valuation and other metrics stack up.
One final note, you should learn about the 3 warning signs we've spotted with Park & Bellheimer (including 1 which makes us a bit uncomfortable) .
If you want to search for solid companies with great earnings, check out this free list of companies with good balance sheets and impressive returns on equity.
Have feedback on this article? Concerned about the content? Get in touch with us directly. Alternatively, email editorial-team (at) simplywallst.com.
This article by Simply Wall St is general in nature. We provide commentary based on historical data and analyst forecasts only using an unbiased methodology and our articles are not intended to be financial advice. It does not constitute a recommendation to buy or sell any stock, and does not take account of your objectives, or your financial situation. We aim to bring you long-term focused analysis driven by fundamental data. Note that our analysis may not factor in the latest price-sensitive company announcements or qualitative material. Simply Wall St has no position in any stocks mentioned.