
 Yahoo Finance
 Returns On Capital Are Showing Encouraging Signs At Del Monte Pacific (SGX:D03)
If we want to find a stock that could multiply over the long term, what are the underlying trends we should look for? Typically, we'll want to notice a trend of growing return on capital employed (ROCE) and alongside that, an expanding base of capital employed. Ultimately, this demonstrates that it's a business that is reinvesting profits at increasing rates of return. Speaking of which, we noticed some great changes in Del Monte Pacific's (SGX:D03) returns on capital, so let's have a look.
Return On Capital Employed (ROCE): What Is It?
If you haven't worked with ROCE before, it measures the 'return' (pre-tax profit) a company generates from capital employed in its business. The formula for this calculation on Del Monte Pacific is:
Return on Capital Employed = Earnings Before Interest and Tax (EBIT) ÷ (Total Assets - Current Liabilities)
0.085 = US$129m ÷ (US$3.4b - US$1.9b) (Based on the trailing twelve months to January 2024).
So, Del Monte Pacific has an ROCE of 8.5%. On its own, that's a low figure but it's around the 7.4% average generated by the Food industry.
Check out our latest analysis for Del Monte Pacific
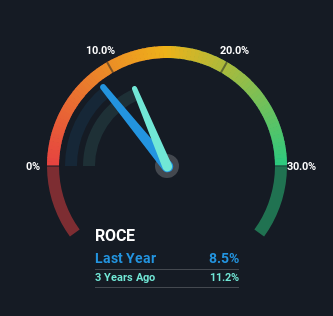
Historical performance is a great place to start when researching a stock so above you can see the gauge for Del Monte Pacific's ROCE against it's prior returns. If you want to delve into the historical earnings , check out these free graphs detailing revenue and cash flow performance of Del Monte Pacific.
How Are Returns Trending?
Del Monte Pacific has not disappointed with their ROCE growth. Looking at the data, we can see that even though capital employed in the business has remained relatively flat, the ROCE generated has risen by 251% over the last five years. Basically the business is generating higher returns from the same amount of capital and that is proof that there are improvements in the company's efficiencies. It's worth looking deeper into this though because while it's great that the business is more efficient, it might also mean that going forward the areas to invest internally for the organic growth are lacking.
For the record though, there was a noticeable increase in the company's current liabilities over the period, so we would attribute some of the ROCE growth to that. Effectively this means that suppliers or short-term creditors are now funding 55% of the business, which is more than it was five years ago. And with current liabilities at those levels, that's pretty high.
What We Can Learn From Del Monte Pacific's ROCE
In summary, we're delighted to see that Del Monte Pacific has been able to increase efficiencies and earn higher rates of return on the same amount of capital. Investors may not be impressed by the favorable underlying trends yet because over the last five years the stock has only returned 16% to shareholders. So exploring more about this stock could uncover a good opportunity, if the valuation and other metrics stack up.
Del Monte Pacific does have some risks though, and we've spotted 1 warning sign for Del Monte Pacific that you might be interested in.
While Del Monte Pacific isn't earning the highest return, check out this free list of companies that are earning high returns on equity with solid balance sheets.
Have feedback on this article? Concerned about the content? Get in touch with us directly. Alternatively, email editorial-team (at) simplywallst.com.
This article by Simply Wall St is general in nature. We provide commentary based on historical data and analyst forecasts only using an unbiased methodology and our articles are not intended to be financial advice. It does not constitute a recommendation to buy or sell any stock, and does not take account of your objectives, or your financial situation. We aim to bring you long-term focused analysis driven by fundamental data. Note that our analysis may not factor in the latest price-sensitive company announcements or qualitative material. Simply Wall St has no position in any stocks mentioned.
