
 Yahoo Finance
 Returns On Capital Signal Tricky Times Ahead For Croda International (LON:CRDA)
If you're not sure where to start when looking for the next multi-bagger, there are a few key trends you should keep an eye out for. In a perfect world, we'd like to see a company investing more capital into its business and ideally the returns earned from that capital are also increasing. Put simply, these types of businesses are compounding machines, meaning they are continually reinvesting their earnings at ever-higher rates of return. However, after investigating Croda International (LON:CRDA), we don't think it's current trends fit the mold of a multi-bagger.
What Is Return On Capital Employed (ROCE)?
Just to clarify if you're unsure, ROCE is a metric for evaluating how much pre-tax income (in percentage terms) a company earns on the capital invested in its business. To calculate this metric for Croda International, this is the formula:
Return on Capital Employed = Earnings Before Interest and Tax (EBIT) ÷ (Total Assets - Current Liabilities)
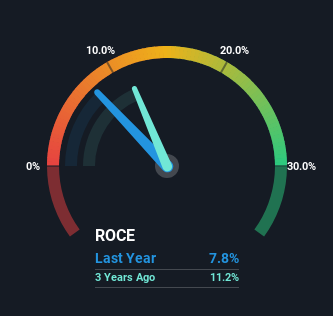
0.078 = UK£253m ÷ (UK£3.6b - UK£320m) (Based on the trailing twelve months to December 2023).
Therefore, Croda International has an ROCE of 7.8%. Ultimately, that's a low return and it under-performs the Chemicals industry average of 11%.
Check out our latest analysis for Croda International
In the above chart we have measured Croda International's prior ROCE against its prior performance, but the future is arguably more important. If you'd like to see what analysts are forecasting going forward, you should check out our free analyst report for Croda International .
What Can We Tell From Croda International's ROCE Trend?
When we looked at the ROCE trend at Croda International, we didn't gain much confidence. To be more specific, ROCE has fallen from 20% over the last five years. Given the business is employing more capital while revenue has slipped, this is a bit concerning. This could mean that the business is losing its competitive advantage or market share, because while more money is being put into ventures, it's actually producing a lower return - "less bang for their buck" per se.
The Key Takeaway
We're a bit apprehensive about Croda International because despite more capital being deployed in the business, returns on that capital and sales have both fallen. Investors must expect better things on the horizon though because the stock has risen 10% in the last five years. Regardless, we don't like the trends as they are and if they persist, we think you might find better investments elsewhere.
One more thing to note, we've identified 1 warning sign with Croda International and understanding it should be part of your investment process.
While Croda International may not currently earn the highest returns, we've compiled a list of companies that currently earn more than 25% return on equity. Check out this free list here.
Have feedback on this article? Concerned about the content? Get in touch with us directly. Alternatively, email editorial-team (at) simplywallst.com.
This article by Simply Wall St is general in nature. We provide commentary based on historical data and analyst forecasts only using an unbiased methodology and our articles are not intended to be financial advice. It does not constitute a recommendation to buy or sell any stock, and does not take account of your objectives, or your financial situation. We aim to bring you long-term focused analysis driven by fundamental data. Note that our analysis may not factor in the latest price-sensitive company announcements or qualitative material. Simply Wall St has no position in any stocks mentioned.
