
 Yahoo Finance
 Returns On Capital Signal Tricky Times Ahead For Caesars Entertainment (NASDAQ:CZR)
To find a multi-bagger stock, what are the underlying trends we should look for in a business? In a perfect world, we'd like to see a company investing more capital into its business and ideally the returns earned from that capital are also increasing. This shows us that it's a compounding machine, able to continually reinvest its earnings back into the business and generate higher returns. Although, when we looked at Caesars Entertainment (NASDAQ:CZR), it didn't seem to tick all of these boxes.
Understanding Return On Capital Employed (ROCE)
For those who don't know, ROCE is a measure of a company's yearly pre-tax profit (its return), relative to the capital employed in the business. To calculate this metric for Caesars Entertainment, this is the formula:
Return on Capital Employed = Earnings Before Interest and Tax (EBIT) ÷ (Total Assets - Current Liabilities)
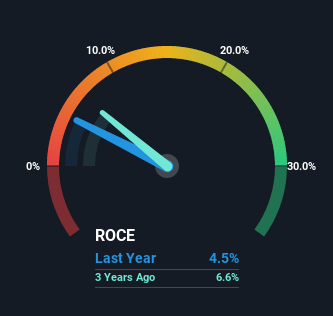
0.045 = US$1.4b ÷ (US$37b - US$5.1b) (Based on the trailing twelve months to March 2022).
So, Caesars Entertainment has an ROCE of 4.5%. In absolute terms, that's a low return and it also under-performs the Hospitality industry average of 10%.
View our latest analysis for Caesars Entertainment
In the above chart we have measured Caesars Entertainment's prior ROCE against its prior performance, but the future is arguably more important. If you'd like to see what analysts are forecasting going forward, you should check out our free report for Caesars Entertainment.
What Does the ROCE Trend For Caesars Entertainment Tell Us?
In terms of Caesars Entertainment's historical ROCE movements, the trend isn't fantastic. Around five years ago the returns on capital were 6.1%, but since then they've fallen to 4.5%. Although, given both revenue and the amount of assets employed in the business have increased, it could suggest the company is investing in growth, and the extra capital has led to a short-term reduction in ROCE. And if the increased capital generates additional returns, the business, and thus shareholders, will benefit in the long run.
The Key Takeaway
Even though returns on capital have fallen in the short term, we find it promising that revenue and capital employed have both increased for Caesars Entertainment. And long term investors must be optimistic going forward because the stock has returned a huge 101% to shareholders in the last five years. So should these growth trends continue, we'd be optimistic on the stock going forward.
One more thing to note, we've identified 1 warning sign with Caesars Entertainment and understanding this should be part of your investment process.
While Caesars Entertainment may not currently earn the highest returns, we've compiled a list of companies that currently earn more than 25% return on equity. Check out this free list here.
Have feedback on this article? Concerned about the content? Get in touch with us directly. Alternatively, email editorial-team (at) simplywallst.com.
This article by Simply Wall St is general in nature. We provide commentary based on historical data and analyst forecasts only using an unbiased methodology and our articles are not intended to be financial advice. It does not constitute a recommendation to buy or sell any stock, and does not take account of your objectives, or your financial situation. We aim to bring you long-term focused analysis driven by fundamental data. Note that our analysis may not factor in the latest price-sensitive company announcements or qualitative material. Simply Wall St has no position in any stocks mentioned.
