
 Yahoo Finance
 Returns At Western Energy Services (TSE:WRG) Are On The Way Up
What are the early trends we should look for to identify a stock that could multiply in value over the long term? Typically, we'll want to notice a trend of growing return on capital employed (ROCE) and alongside that, an expanding base of capital employed. Basically this means that a company has profitable initiatives that it can continue to reinvest in, which is a trait of a compounding machine. So on that note, Western Energy Services (TSE:WRG) looks quite promising in regards to its trends of return on capital.
Return On Capital Employed (ROCE): What Is It?
Just to clarify if you're unsure, ROCE is a metric for evaluating how much pre-tax income (in percentage terms) a company earns on the capital invested in its business. Analysts use this formula to calculate it for Western Energy Services:
Return on Capital Employed = Earnings Before Interest and Tax (EBIT) ÷ (Total Assets - Current Liabilities)
0.0054 = CA$2.3m ÷ (CA$454m - CA$35m) (Based on the trailing twelve months to September 2023).
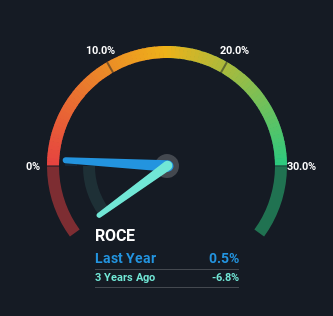
So, Western Energy Services has an ROCE of 0.5%. In absolute terms, that's a low return and it also under-performs the Energy Services industry average of 13%.
See our latest analysis for Western Energy Services
In the above chart we have measured Western Energy Services' prior ROCE against its prior performance, but the future is arguably more important. If you'd like to see what analysts are forecasting going forward, you should check out our free report for Western Energy Services.
What Does the ROCE Trend For Western Energy Services Tell Us?
Like most people, we're pleased that Western Energy Services is now generating some pretax earnings. The company was generating losses five years ago, but now it's turned around, earning 0.5% which is no doubt a relief for some early shareholders. In regards to capital employed, Western Energy Services is using 34% less capital than it was five years ago, which on the surface, can indicate that the business has become more efficient at generating these returns. This could potentially mean that the company is selling some of its assets.
The Key Takeaway
In summary, it's great to see that Western Energy Services has been able to turn things around and earn higher returns on lower amounts of capital. Although the company may be facing some issues elsewhere since the stock has plunged 96% in the last five years. In any case, we believe the economic trends of this company are positive and looking into the stock further could prove rewarding.
If you want to continue researching Western Energy Services, you might be interested to know about the 1 warning sign that our analysis has discovered.
If you want to search for solid companies with great earnings, check out this free list of companies with good balance sheets and impressive returns on equity.
Have feedback on this article? Concerned about the content? Get in touch with us directly. Alternatively, email editorial-team (at) simplywallst.com.
This article by Simply Wall St is general in nature. We provide commentary based on historical data and analyst forecasts only using an unbiased methodology and our articles are not intended to be financial advice. It does not constitute a recommendation to buy or sell any stock, and does not take account of your objectives, or your financial situation. We aim to bring you long-term focused analysis driven by fundamental data. Note that our analysis may not factor in the latest price-sensitive company announcements or qualitative material. Simply Wall St has no position in any stocks mentioned.
