
 Yahoo Finance
 Risks To Shareholder Returns Are Elevated At These Prices For Sarepta Therapeutics, Inc. (NASDAQ:SRPT)
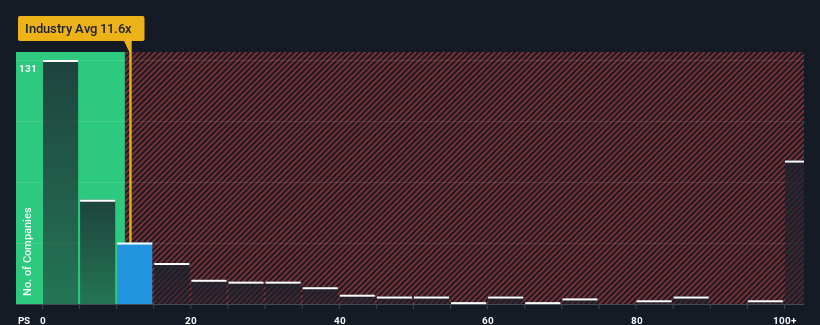
It's not a stretch to say that Sarepta Therapeutics, Inc.'s (NASDAQ:SRPT) price-to-sales (or "P/S") ratio of 11.8x right now seems quite "middle-of-the-road" for companies in the Biotechs industry in the United States, where the median P/S ratio is around 11.6x. However, investors might be overlooking a clear opportunity or potential setback if there is no rational basis for the P/S.
See our latest analysis for Sarepta Therapeutics
What Does Sarepta Therapeutics' Recent Performance Look Like?
Recent times haven't been great for Sarepta Therapeutics as its revenue has been rising slower than most other companies. It might be that many expect the uninspiring revenue performance to strengthen positively, which has kept the P/S ratio from falling. You'd really hope so, otherwise you're paying a relatively elevated price for a company with this sort of growth profile.
If you'd like to see what analysts are forecasting going forward, you should check out our free report on Sarepta Therapeutics.
What Are Revenue Growth Metrics Telling Us About The P/S?
There's an inherent assumption that a company should be matching the industry for P/S ratios like Sarepta Therapeutics' to be considered reasonable.
Retrospectively, the last year delivered an exceptional 33% gain to the company's top line. The strong recent performance means it was also able to grow revenue by 145% in total over the last three years. Accordingly, shareholders would have definitely welcomed those medium-term rates of revenue growth.
Shifting to the future, estimates from the analysts covering the company suggest revenue should grow by 51% each year over the next three years. With the industry predicted to deliver 97% growth per year, the company is positioned for a weaker revenue result.
With this information, we find it interesting that Sarepta Therapeutics is trading at a fairly similar P/S compared to the industry. Apparently many investors in the company are less bearish than analysts indicate and aren't willing to let go of their stock right now. Maintaining these prices will be difficult to achieve as this level of revenue growth is likely to weigh down the shares eventually.
What We Can Learn From Sarepta Therapeutics' P/S?
Generally, our preference is to limit the use of the price-to-sales ratio to establishing what the market thinks about the overall health of a company.
Our look at the analysts forecasts of Sarepta Therapeutics' revenue prospects has shown that its inferior revenue outlook isn't negatively impacting its P/S as much as we would have predicted. At present, we aren't confident in the P/S as the predicted future revenues aren't likely to support a more positive sentiment for long. Circumstances like this present a risk to current and prospective investors who may see share prices fall if the low revenue growth impacts the sentiment.
The company's balance sheet is another key area for risk analysis. You can assess many of the main risks through our free balance sheet analysis for Sarepta Therapeutics with six simple checks.
If strong companies turning a profit tickle your fancy, then you'll want to check out this free list of interesting companies that trade on a low P/E (but have proven they can grow earnings).
Have feedback on this article? Concerned about the content? Get in touch with us directly. Alternatively, email editorial-team (at) simplywallst.com.
This article by Simply Wall St is general in nature. We provide commentary based on historical data and analyst forecasts only using an unbiased methodology and our articles are not intended to be financial advice. It does not constitute a recommendation to buy or sell any stock, and does not take account of your objectives, or your financial situation. We aim to bring you long-term focused analysis driven by fundamental data. Note that our analysis may not factor in the latest price-sensitive company announcements or qualitative material. Simply Wall St has no position in any stocks mentioned.
Join A Paid User Research Session
You’ll receive a US$30 Amazon Gift card for 1 hour of your time while helping us build better investing tools for the individual investors like yourself. Sign up here
