
 Yahoo Finance
 Is RM plc's (LON:RM.) Stock Price Struggling As A Result Of Its Mixed Financials?
It is hard to get excited after looking at RM's (LON:RM.) recent performance, when its stock has declined 26% over the past three months. It seems that the market might have completely ignored the positive aspects of the company's fundamentals and decided to weigh-in more on the negative aspects. Long-term fundamentals are usually what drive market outcomes, so it's worth paying close attention. Particularly, we will be paying attention to RM's ROE today.
ROE or return on equity is a useful tool to assess how effectively a company can generate returns on the investment it received from its shareholders. Simply put, it is used to assess the profitability of a company in relation to its equity capital.
View our latest analysis for RM
How To Calculate Return On Equity?
ROE can be calculated by using the formula:
Return on Equity = Net Profit (from continuing operations) ÷ Shareholders' Equity
So, based on the above formula, the ROE for RM is:
4.8% = UK£4.2m ÷ UK£88m (Based on the trailing twelve months to November 2021).
The 'return' is the amount earned after tax over the last twelve months. So, this means that for every £1 of its shareholder's investments, the company generates a profit of £0.05.
Why Is ROE Important For Earnings Growth?
So far, we've learned that ROE is a measure of a company's profitability. Based on how much of its profits the company chooses to reinvest or "retain", we are then able to evaluate a company's future ability to generate profits. Assuming all else is equal, companies that have both a higher return on equity and higher profit retention are usually the ones that have a higher growth rate when compared to companies that don't have the same features.
RM's Earnings Growth And 4.8% ROE
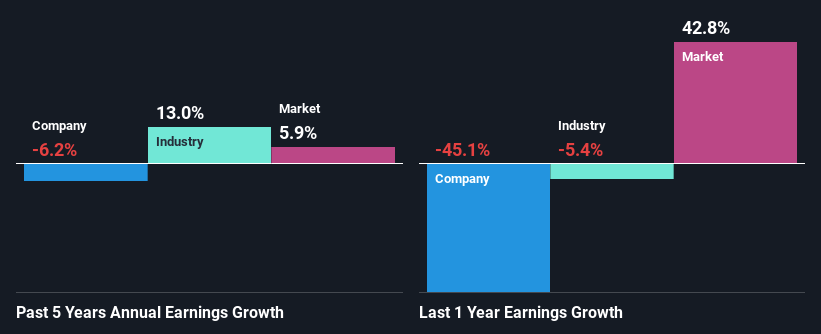
At first glance, RM's ROE doesn't look very promising. We then compared the company's ROE to the broader industry and were disappointed to see that the ROE is lower than the industry average of 9.3%. Therefore, it might not be wrong to say that the five year net income decline of 6.2% seen by RM was probably the result of it having a lower ROE. We reckon that there could also be other factors at play here. Such as - low earnings retention or poor allocation of capital.
So, as a next step, we compared RM's performance against the industry and were disappointed to discover that while the company has been shrinking its earnings, the industry has been growing its earnings at a rate of 13% in the same period.
The basis for attaching value to a company is, to a great extent, tied to its earnings growth. What investors need to determine next is if the expected earnings growth, or the lack of it, is already built into the share price. This then helps them determine if the stock is placed for a bright or bleak future. One good indicator of expected earnings growth is the P/E ratio which determines the price the market is willing to pay for a stock based on its earnings prospects. So, you may want to check if RM is trading on a high P/E or a low P/E, relative to its industry.
Is RM Efficiently Re-investing Its Profits?
In spite of a normal three-year median payout ratio of 32% (that is, a retention ratio of 68%), the fact that RM's earnings have shrunk is quite puzzling. So there might be other factors at play here which could potentially be hampering growth. For example, the business has faced some headwinds.
Additionally, RM has paid dividends over a period of at least ten years, which means that the company's management is determined to pay dividends even if it means little to no earnings growth. Our latest analyst data shows that the future payout ratio of the company over the next three years is expected to be approximately 29%.
Conclusion
Overall, we have mixed feelings about RM. While the company does have a high rate of profit retention, its low rate of return is probably hampering its earnings growth. Wrapping up, we would proceed with caution with this company and one way of doing that would be to look at the risk profile of the business. To know the 5 risks we have identified for RM visit our risks dashboard for free.
Have feedback on this article? Concerned about the content? Get in touch with us directly. Alternatively, email editorial-team (at) simplywallst.com.
This article by Simply Wall St is general in nature. We provide commentary based on historical data and analyst forecasts only using an unbiased methodology and our articles are not intended to be financial advice. It does not constitute a recommendation to buy or sell any stock, and does not take account of your objectives, or your financial situation. We aim to bring you long-term focused analysis driven by fundamental data. Note that our analysis may not factor in the latest price-sensitive company announcements or qualitative material. Simply Wall St has no position in any stocks mentioned.
