
 Yahoo Finance
 Are Robust Financials Driving The Recent Rally In Corcept Therapeutics Incorporated's (NASDAQ:CORT) Stock?
Corcept Therapeutics' (NASDAQ:CORT) stock is up by a considerable 5.5% over the past month. Given the company's impressive performance, we decided to study its financial indicators more closely as a company's financial health over the long-term usually dictates market outcomes. In this article, we decided to focus on Corcept Therapeutics' ROE.
Return on equity or ROE is a key measure used to assess how efficiently a company's management is utilizing the company's capital. In other words, it is a profitability ratio which measures the rate of return on the capital provided by the company's shareholders.
Check out our latest analysis for Corcept Therapeutics
How To Calculate Return On Equity?
The formula for return on equity is:
Return on Equity = Net Profit (from continuing operations) ÷ Shareholders' Equity
So, based on the above formula, the ROE for Corcept Therapeutics is:
19% = US$98m ÷ US$523m (Based on the trailing twelve months to June 2021).
The 'return' is the amount earned after tax over the last twelve months. That means that for every $1 worth of shareholders' equity, the company generated $0.19 in profit.
Why Is ROE Important For Earnings Growth?
We have already established that ROE serves as an efficient profit-generating gauge for a company's future earnings. We now need to evaluate how much profit the company reinvests or "retains" for future growth which then gives us an idea about the growth potential of the company. Assuming all else is equal, companies that have both a higher return on equity and higher profit retention are usually the ones that have a higher growth rate when compared to companies that don't have the same features.
Corcept Therapeutics' Earnings Growth And 19% ROE
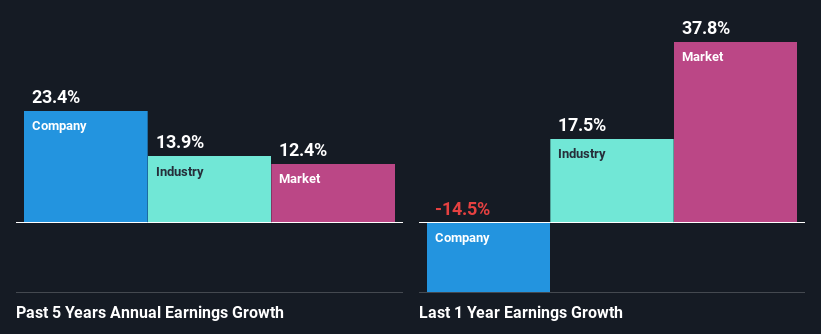
To begin with, Corcept Therapeutics seems to have a respectable ROE. Further, the company's ROE is similar to the industry average of 19%. This certainly adds some context to Corcept Therapeutics' exceptional 23% net income growth seen over the past five years. However, there could also be other drivers behind this growth. Such as - high earnings retention or an efficient management in place.
As a next step, we compared Corcept Therapeutics' net income growth with the industry, and pleasingly, we found that the growth seen by the company is higher than the average industry growth of 14%.
The basis for attaching value to a company is, to a great extent, tied to its earnings growth. What investors need to determine next is if the expected earnings growth, or the lack of it, is already built into the share price. By doing so, they will have an idea if the stock is headed into clear blue waters or if swampy waters await. Is Corcept Therapeutics fairly valued compared to other companies? These 3 valuation measures might help you decide.
Is Corcept Therapeutics Efficiently Re-investing Its Profits?
Conclusion
On the whole, we feel that Corcept Therapeutics' performance has been quite good. Particularly, we like that the company is reinvesting heavily into its business, and at a high rate of return. Unsurprisingly, this has led to an impressive earnings growth. That being so, the latest analyst forecasts show that the company will continue to see an expansion in its earnings. To know more about the latest analysts predictions for the company, check out this visualization of analyst forecasts for the company.
This article by Simply Wall St is general in nature. We provide commentary based on historical data and analyst forecasts only using an unbiased methodology and our articles are not intended to be financial advice. It does not constitute a recommendation to buy or sell any stock, and does not take account of your objectives, or your financial situation. We aim to bring you long-term focused analysis driven by fundamental data. Note that our analysis may not factor in the latest price-sensitive company announcements or qualitative material. Simply Wall St has no position in any stocks mentioned.
Have feedback on this article? Concerned about the content? Get in touch with us directly. Alternatively, email editorial-team (at) simplywallst.com.
