
 Yahoo Finance
 With An ROE Of 15.07%, Has Kitron ASA’s (OB:KIT) Management Done Well?

This article is intended for those of you who are at the beginning of your investing journey and want a simplistic look at the return on Kitron ASA (OB:KIT) stock.
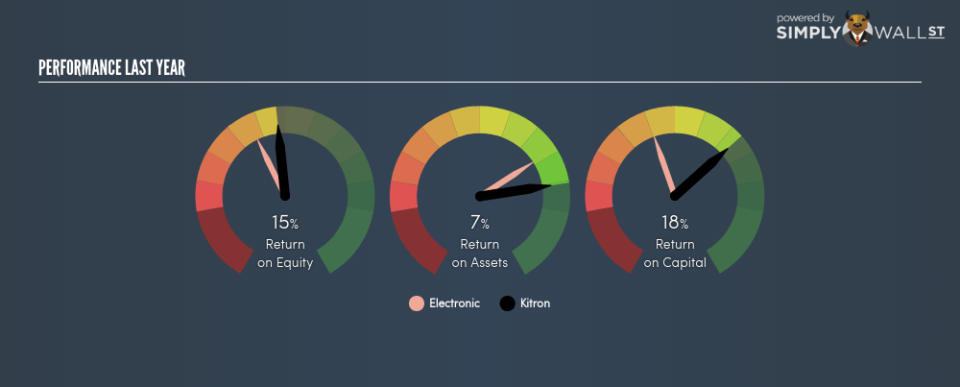
Kitron ASA (OB:KIT) outperformed the Electronic Manufacturing Services industry on the basis of its ROE – producing a higher 15.07% relative to the peer average of 11.32% over the past 12 months. Superficially, this looks great since we know that KIT has generated big profits with little equity capital; however, ROE doesn’t tell us how much KIT has borrowed in debt. In this article, we’ll closely examine some factors like financial leverage to evaluate the sustainability of KIT’s ROE. See our latest analysis for Kitron
What you must know about ROE
Return on Equity (ROE) is a measure of Kitron’s profit relative to its shareholders’ equity. It essentially shows how much the company can generate in earnings given the amount of equity it has raised. Generally speaking, a higher ROE is preferred; however, there are other factors we must also consider before making any conclusions.
Return on Equity = Net Profit ÷ Shareholders Equity
ROE is measured against cost of equity in order to determine the efficiency of Kitron’s equity capital deployed. Its cost of equity is 16.94%. Since Kitron’s return does not cover its cost, with a difference of -1.87%, this means its current use of equity is not efficient and not sustainable. Very simply, Kitron pays more for its capital than what it generates in return. ROE can be broken down into three different ratios: net profit margin, asset turnover, and financial leverage. This is called the Dupont Formula:
Dupont Formula
ROE = profit margin × asset turnover × financial leverage
ROE = (annual net profit ÷ sales) × (sales ÷ assets) × (assets ÷ shareholders’ equity)
ROE = annual net profit ÷ shareholders’ equity
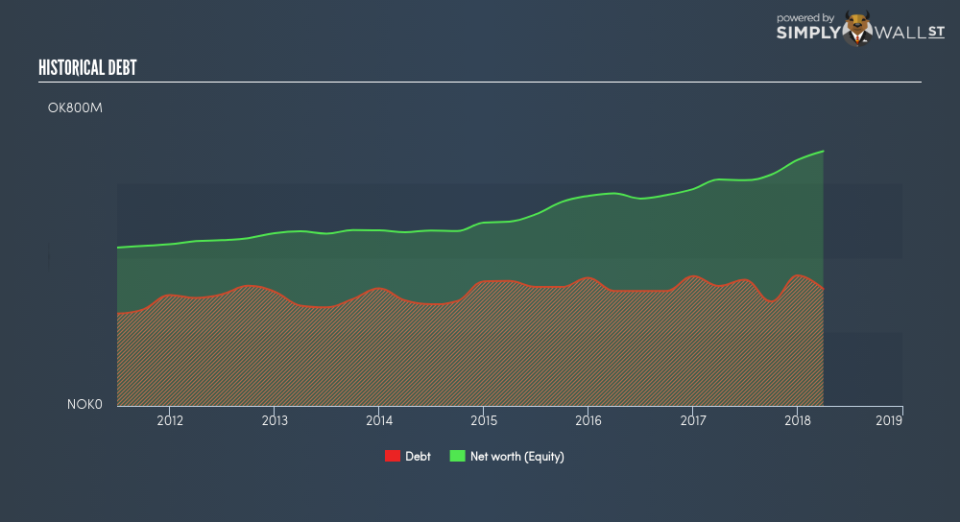
The first component is profit margin, which measures how much of sales is retained after the company pays for all its expenses. Asset turnover shows how much revenue Kitron can generate with its current asset base. Finally, financial leverage will be our main focus today. It shows how much of assets are funded by equity and can show how sustainable the company’s capital structure is. Since financial leverage can artificially inflate ROE, we need to look at how much debt Kitron currently has. At 45.93%, Kitron’s debt-to-equity ratio appears low and indicates the above-average ROE is generated from its capacity to increase profit without a large debt burden.
Next Steps:
ROE is a simple yet informative ratio, illustrating the various components that each measure the quality of the overall stock. Kitron exhibits a strong ROE against its peers, however it was not high enough to cover its own cost of equity this year. ROE is not likely to be inflated by excessive debt funding, giving shareholders more conviction in the sustainability of industry-beating returns. Although ROE can be a useful metric, it is only a small part of diligent research.
For Kitron, I’ve put together three essential factors you should look at:
Financial Health: Does it have a healthy balance sheet? Take a look at our free balance sheet analysis with six simple checks on key factors like leverage and risk.
Valuation: What is Kitron worth today? Is the stock undervalued, even when its growth outlook is factored into its intrinsic value? The intrinsic value infographic in our free research report helps visualize whether Kitron is currently mispriced by the market.
Other High-Growth Alternatives : Are there other high-growth stocks you could be holding instead of Kitron? Explore our interactive list of stocks with large growth potential to get an idea of what else is out there you may be missing!
To help readers see pass the short term volatility of the financial market, we aim to bring you a long-term focused research analysis purely driven by fundamental data. Note that our analysis does not factor in the latest price sensitive company announcements.
The author is an independent contributor and at the time of publication had no position in the stocks mentioned.
