
 Yahoo Finance
 With An ROE Of 8.74%, Can Colefax Group plc (LON:CFX) Catch Up To The Industry?

This article is intended for those of you who are at the beginning of your investing journey and want to better understand how you can grow your money by investing in Colefax Group plc (LON:CFX).
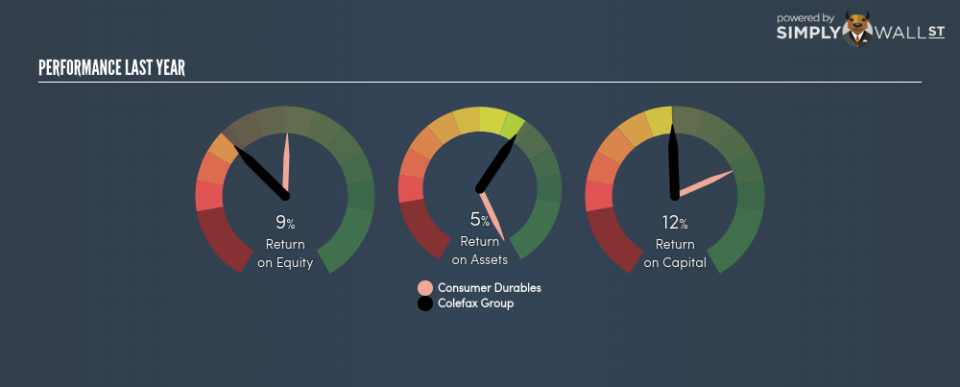
Colefax Group plc (LON:CFX) generated a below-average return on equity of 8.74% in the past 12 months, while its industry returned 16.33%. Though CFX’s recent performance is underwhelming, it is useful to understand what ROE is made up of and how it should be interpreted. Knowing these components can change your views on CFX’s below-average returns. Metrics such as financial leverage can impact the level of ROE which in turn can affect the sustainability of CFX’s returns. Let me show you what I mean by this. View out our latest analysis for Colefax Group
Breaking down Return on Equity
Firstly, Return on Equity, or ROE, is simply the percentage of last years’ earning against the book value of shareholders’ equity. An ROE of 8.74% implies £0.087 returned on every £1 invested. While a higher ROE is preferred in most cases, there are several other factors we should consider before drawing any conclusions.
Return on Equity = Net Profit ÷ Shareholders Equity
ROE is measured against cost of equity in order to determine the efficiency of Colefax Group’s equity capital deployed. Its cost of equity is 8.28%. While Colefax Group’s peers may have higher ROE, it may also incur higher cost of equity. An undesirable and unsustainable practice would be if returns exceeded cost. However, this is not the case for Colefax Group which is encouraging. ROE can be split up into three useful ratios: net profit margin, asset turnover, and financial leverage. This is called the Dupont Formula:
Dupont Formula
ROE = profit margin × asset turnover × financial leverage
ROE = (annual net profit ÷ sales) × (sales ÷ assets) × (assets ÷ shareholders’ equity)
ROE = annual net profit ÷ shareholders’ equity
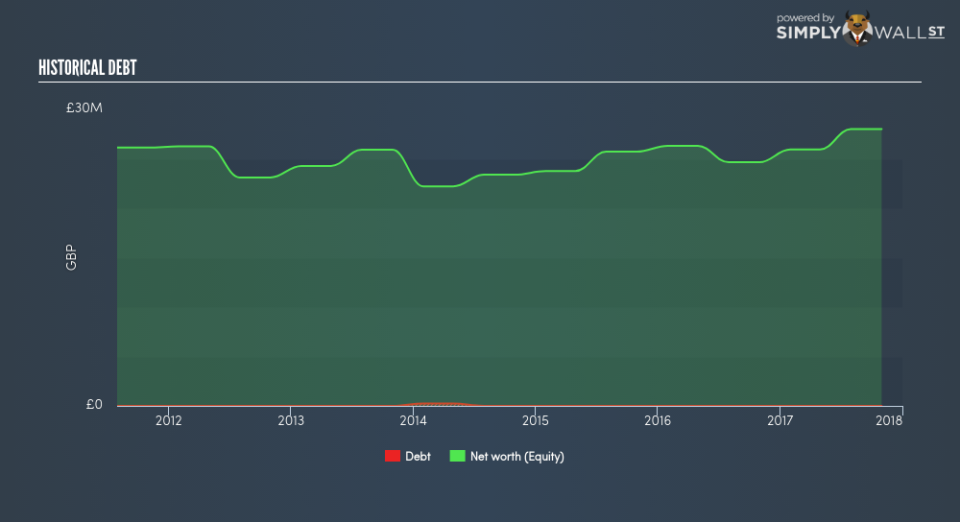
Basically, profit margin measures how much of revenue trickles down into earnings which illustrates how efficient the business is with its cost management. The other component, asset turnover, illustrates how much revenue Colefax Group can make from its asset base. And finally, financial leverage is simply how much of assets are funded by equity, which exhibits how sustainable the company’s capital structure is. Since ROE can be artificially increased through excessive borrowing, we should check Colefax Group’s historic debt-to-equity ratio. Currently, Colefax Group has no debt which means its returns are driven purely by equity capital. This could explain why Colefax Group’s’ ROE is lower than its industry peers, most of which may have some degree of debt in its business.
Next Steps:
ROE is one of many ratios which meaningfully dissects financial statements, which illustrates the quality of a company. Even though Colefax Group returned below the industry average, its ROE comes in excess of its cost of equity. Also, ROE is not likely to be inflated by excessive debt funding, giving shareholders more conviction in the sustainability of returns, which has headroom to increase further. ROE is a helpful signal, but it is definitely not sufficient on its own to make an investment decision.
For Colefax Group, I’ve compiled three important aspects you should further research:
Financial Health: Does it have a healthy balance sheet? Take a look at our free balance sheet analysis with six simple checks on key factors like leverage and risk.
Valuation: What is Colefax Group worth today? Is the stock undervalued, even when its growth outlook is factored into its intrinsic value? The intrinsic value infographic in our free research report helps visualize whether Colefax Group is currently mispriced by the market.
Other High-Growth Alternatives : Are there other high-growth stocks you could be holding instead of Colefax Group? Explore our interactive list of stocks with large growth potential to get an idea of what else is out there you may be missing!
To help readers see pass the short term volatility of the financial market, we aim to bring you a long-term focused research analysis purely driven by fundamental data. Note that our analysis does not factor in the latest price sensitive company announcements.
The author is an independent contributor and at the time of publication had no position in the stocks mentioned.
