
 Yahoo Finance
 RTC Group's (LON:RTC) Returns On Capital Not Reflecting Well On The Business
If you're looking for a multi-bagger, there's a few things to keep an eye out for. Ideally, a business will show two trends; firstly a growing return on capital employed (ROCE) and secondly, an increasing amount of capital employed. If you see this, it typically means it's a company with a great business model and plenty of profitable reinvestment opportunities. So while RTC Group (LON:RTC) has a high ROCE right now, lets see what we can decipher from how returns are changing.
Return On Capital Employed (ROCE): What Is It?
For those who don't know, ROCE is a measure of a company's yearly pre-tax profit (its return), relative to the capital employed in the business. To calculate this metric for RTC Group, this is the formula:
Return on Capital Employed = Earnings Before Interest and Tax (EBIT) ÷ (Total Assets - Current Liabilities)
0.26 = UK£2.7m ÷ (UK£22m - UK£12m) (Based on the trailing twelve months to December 2023).
Thus, RTC Group has an ROCE of 26%. That's a fantastic return and not only that, it outpaces the average of 18% earned by companies in a similar industry.
See our latest analysis for RTC Group
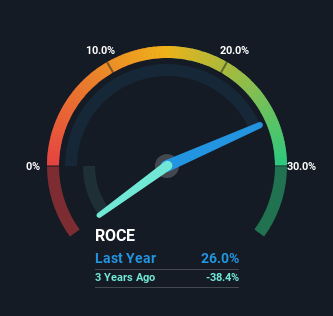
Historical performance is a great place to start when researching a stock so above you can see the gauge for RTC Group's ROCE against it's prior returns. If you want to delve into the historical earnings , check out these free graphs detailing revenue and cash flow performance of RTC Group.
So How Is RTC Group's ROCE Trending?
On the surface, the trend of ROCE at RTC Group doesn't inspire confidence. While it's comforting that the ROCE is high, five years ago it was 37%. Although, given both revenue and the amount of assets employed in the business have increased, it could suggest the company is investing in growth, and the extra capital has led to a short-term reduction in ROCE. And if the increased capital generates additional returns, the business, and thus shareholders, will benefit in the long run.
On a related note, RTC Group has decreased its current liabilities to 53% of total assets. That could partly explain why the ROCE has dropped. Effectively this means their suppliers or short-term creditors are funding less of the business, which reduces some elements of risk. Some would claim this reduces the business' efficiency at generating ROCE since it is now funding more of the operations with its own money. Either way, they're still at a pretty high level, so we'd like to see them fall further if possible.
In Conclusion...
In summary, despite lower returns in the short term, we're encouraged to see that RTC Group is reinvesting for growth and has higher sales as a result. And the stock has followed suit returning a meaningful 93% to shareholders over the last five years. So should these growth trends continue, we'd be optimistic on the stock going forward.
RTC Group does have some risks, we noticed 3 warning signs (and 1 which is a bit concerning) we think you should know about.
If you'd like to see other companies earning high returns, check out our free list of companies earning high returns with solid balance sheets here.
Have feedback on this article? Concerned about the content? Get in touch with us directly. Alternatively, email editorial-team (at) simplywallst.com.
This article by Simply Wall St is general in nature. We provide commentary based on historical data and analyst forecasts only using an unbiased methodology and our articles are not intended to be financial advice. It does not constitute a recommendation to buy or sell any stock, and does not take account of your objectives, or your financial situation. We aim to bring you long-term focused analysis driven by fundamental data. Note that our analysis may not factor in the latest price-sensitive company announcements or qualitative material. Simply Wall St has no position in any stocks mentioned.
Have feedback on this article? Concerned about the content? Get in touch with us directly. Alternatively, email editorial-team@simplywallst.com
