
 Yahoo Finance
 Ryder (R) Q1 Earnings & Revenues Beat, 2024 EPS View Up
Ryder System, Inc. R first-quarter 2024 earnings per share (EPS) of $2.14 surpassed the Zacks Consensus Estimate of $1.62. However, the bottom line plunged 23.8% year over year, reflecting weaker market conditions in used vehicle sales and rental, partially offset by higher Supply Chain Solutions and ChoiceLease results.
Total revenues of $3,098 million outpaced the Zacks Consensus Estimate of $3,013.1 million and improved 5% year over year. Operating revenues of $2,495 million grew 6% year over year, reflecting recent acquisitions and contractual revenue growth, partially offset by lower commercial rental revenue in Fleet Management Solutions.
Ryder, chairman and chief executive officer, Robert Sanchez, stated, "The outperformance in the quarter was driven by better-than-expected used vehicle results and benefits from our ongoing maintenance cost savings initiative. The actions we’ve taken to de-risk the model, enhance returns, and drive profitable growth are delivering improved results relative to prior cycles. ROE was 17% and in line with our target, reflecting the transformation of our business model and increased resiliency.”
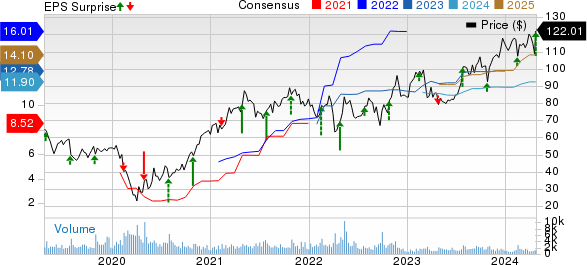
Ryder System, Inc. Price, Consensus and EPS Surprise
Ryder System, Inc. price-consensus-eps-surprise-chart | Ryder System, Inc. Quote
Segmental Results
Fleet Management Solutions: Total revenues of $1,455 million dipped 3% year over year owing to lower fuel costs passed through to customers and lower operating revenues.
Operating revenues summed $1,251 million, down 1% year over year owing to lower commercial rental revenues, largely offset by higher ChoiceLease revenues.
Supply-Chain Solutions: Total revenues of $1,302 million inched up 8% year over year, backed by higher operating revenues and higher subcontracted transportation costs passed through to customers.
Operating revenues rose 11% year over year to $972 million, mainly due to benefits fromrecent acquisitions.
Dedicated Transportation Solutions: Total revenues of $563 million and operating revenues of $427 million increased 24% and 33%, year over year, respectively, owing to the Cardinal Logistics acquisition.
Liquidity & Buyback
Ryder exited the first quarter with cash and cash equivalents of $234 million compared with $204 million at the end of the prior quarter. R’s total debt (including the current portion) was $7,543 million at the first-quarter end compared with $7,114 million at the end of the prior quarter.
R generated $526 million of net cash from operating activities in the reported quarter.Free cash flow came in at $13 million. Capital expenditures were $686 million.
During first-quarter 2024, Ryder paid dividends of $35 million and repurchased shares worth $51 million.
Outlook
For second-quarter 2024, Ryder expects adjusted EPS in the range of $2.75-$2.95. The Zacks Consensus Estimate of $2.77 lies within the guidance.
For 2024, Ryder has updated its guidance. Adjusted EPS for the year is now estimated to be between $11.75 and $12.50 (prior view: $11.50 - $12.50). The Zacks Consensus Estimate of $11.90 lies within the guidance.
Adjusted ROE (return on equity) is now suggested in the 15.5%-16.5% band (prior view: 15% - 16.5% band).
Management now anticipates total revenues to increase by almost 10% (prior view: up 13%). Operating revenues (adjusted) are now forecasted to increase 10% (prior view: up 13%).
Net cash from operating activities is still projected to be $2.4 billion. Capital expenditure is estimated to be $3.2 billion (prior view: $3.3 billion).
Currently, Ryder carries a Zacks Rank #2 (Buy). You can see the complete list of today’s Zacks #1 Rank (Strong Buy) stocks here.
Performances of Other Transportation Companies
Delta Air Lines DAL reported first-quarter 2024 earnings (excluding 39 cents from non-recurring items) of 45 cents per share, which comfortably beat the Zacks Consensus Estimate of 36 cents. Earnings increased 80% on a year-over-year basis.
Revenues of $13.75 billion surpassed the Zacks Consensus Estimate of $12.84 billion and increased 7.75% on a year-over-year basis, driven by strong air-travel demand. Adjusted operating revenues (excluding third-party refinery sales) came in at $12.56 billion, up 6% year over year.
United Airlines Holdings, Inc. UAL reported first-quarter 2024 loss per share (excluding 23 cents from non-recurring items) of 15 cents, which was narrower than the Zacks Consensus Estimate loss of 53 cents. In the year-ago reported quarter, UAL reported a loss of 63 cents per share.
Operating revenues of $12,539 million beat the Zacks Consensus Estimate of $12,428.4 million. The top line increased 9.7% year over year due to upbeat air-travel demand. This was driven by a 10.1% rise in passenger revenues (accounting for 90.2% of the top line) to $11,313 million. Almost 39,325 passengers traveled on UAL flights in the first quarter, up 6.8% year over year.
J.B. Hunt Transport Services, Inc.’s JBHT first-quarter 2024 earnings of $1.22 per share missed the Zacks Consensus Estimate of $1.53 and declined 35.5% year over year.
JBHT’s total operating revenues of $2,944 million missed the Zacks Consensus Estimate of $3,117.1 million and fell 8.8% year over year. Total operating revenues, excluding fuel surcharge revenue, fell 7% year over year. The downfall was owing to a 9% decrease in segment gross revenue per load in both Intermodal (JBI) and Truckload (JBT), 22% fewer loads in Integrated Capacity Solution (ICS), and a modest decline in average trucks and productivity in Dedicated Contract Services (DCS). Revenue declines in JBI, ICS, JBT and DCS were partially offset by Final Mile Services (FMS) revenue growth of 2%, primarily driven by new contracts implemented over the past year.
Want the latest recommendations from Zacks Investment Research? Today, you can download 7 Best Stocks for the Next 30 Days. Click to get this free report
Delta Air Lines, Inc. (DAL) : Free Stock Analysis Report
United Airlines Holdings Inc (UAL) : Free Stock Analysis Report
J.B. Hunt Transport Services, Inc. (JBHT) : Free Stock Analysis Report
Ryder System, Inc. (R) : Free Stock Analysis Report
