
 Yahoo Finance
 Sailfish Royalty (CVE:FISH) shareholders have earned a 8.6% CAGR over the last three years
Sailfish Royalty Corp. (CVE:FISH) shareholders might be concerned after seeing the share price drop 15% in the last quarter. On the other hand the share price is higher than it was three years ago. However, it's unlikely many shareholders are elated with the share price gain of 24% over that time, given the rising market.
So let's assess the underlying fundamentals over the last 3 years and see if they've moved in lock-step with shareholder returns.
Check out our latest analysis for Sailfish Royalty
In his essay The Superinvestors of Graham-and-Doddsville Warren Buffett described how share prices do not always rationally reflect the value of a business. One way to examine how market sentiment has changed over time is to look at the interaction between a company's share price and its earnings per share (EPS).
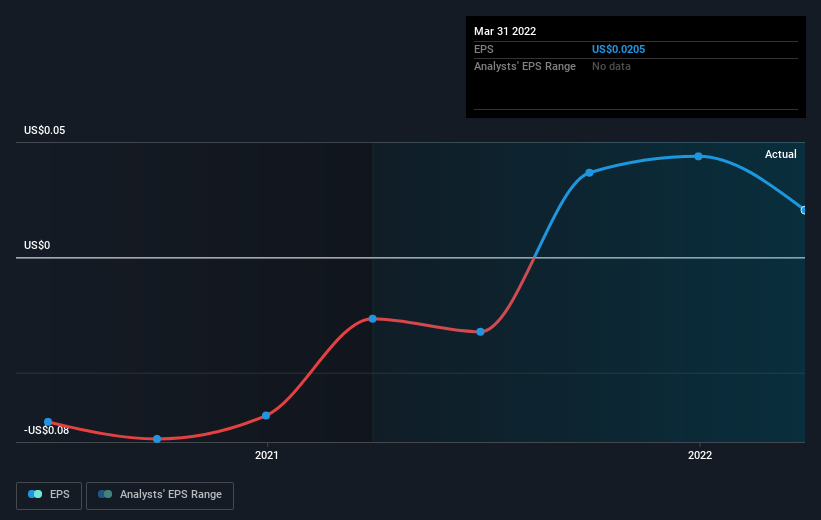
Sailfish Royalty became profitable within the last three years. That would generally be considered a positive, so we'd expect the share price to be up.
You can see below how EPS has changed over time (discover the exact values by clicking on the image).
Before buying or selling a stock, we always recommend a close examination of historic growth trends, available here.
What About Dividends?
When looking at investment returns, it is important to consider the difference between total shareholder return (TSR) and share price return. The TSR is a return calculation that accounts for the value of cash dividends (assuming that any dividend received was reinvested) and the calculated value of any discounted capital raisings and spin-offs. It's fair to say that the TSR gives a more complete picture for stocks that pay a dividend. We note that for Sailfish Royalty the TSR over the last 3 years was 28%, which is better than the share price return mentioned above. The dividends paid by the company have thusly boosted the total shareholder return.
A Different Perspective
The last twelve months weren't great for Sailfish Royalty shares, which cost holders 2.7%, including dividends, while the market was up about 7.5%. Of course the long term matters more than the short term, and even great stocks will sometimes have a poor year. Investors are up over three years, booking 9% per year, much better than the more recent returns. The recent sell-off could be an opportunity if the business remains sound, so it may be worth checking the fundamental data for signs of a long-term growth trend. I find it very interesting to look at share price over the long term as a proxy for business performance. But to truly gain insight, we need to consider other information, too. Consider for instance, the ever-present spectre of investment risk. We've identified 5 warning signs with Sailfish Royalty (at least 1 which is significant) , and understanding them should be part of your investment process.
For those who like to find winning investments this free list of growing companies with recent insider purchasing, could be just the ticket.
Please note, the market returns quoted in this article reflect the market weighted average returns of stocks that currently trade on CA exchanges.
Have feedback on this article? Concerned about the content? Get in touch with us directly. Alternatively, email editorial-team (at) simplywallst.com.
This article by Simply Wall St is general in nature. We provide commentary based on historical data and analyst forecasts only using an unbiased methodology and our articles are not intended to be financial advice. It does not constitute a recommendation to buy or sell any stock, and does not take account of your objectives, or your financial situation. We aim to bring you long-term focused analysis driven by fundamental data. Note that our analysis may not factor in the latest price-sensitive company announcements or qualitative material. Simply Wall St has no position in any stocks mentioned.
