
 Yahoo Finance
 Science Applications International (NASDAQ:SAIC) Is Paying Out A Dividend Of $0.37
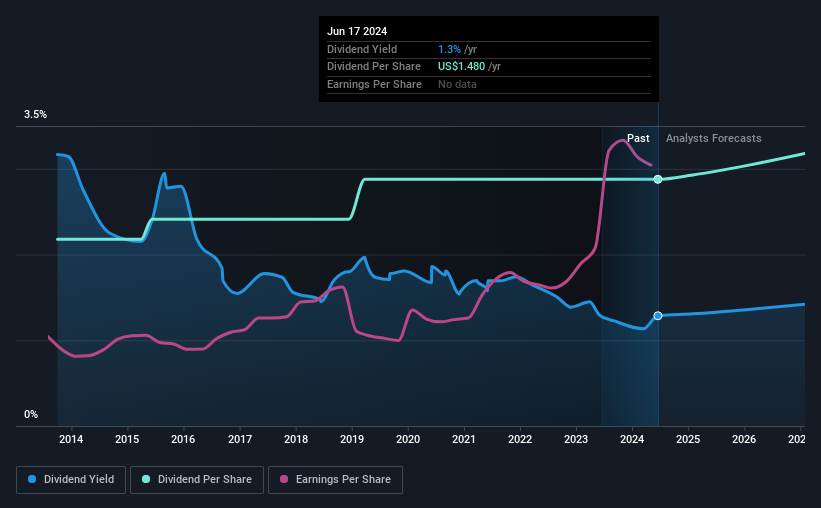
The board of Science Applications International Corporation (NASDAQ:SAIC) has announced that it will pay a dividend on the 26th of July, with investors receiving $0.37 per share. The dividend yield is 1.3% based on this payment, which is a little bit low compared to the other companies in the industry.
View our latest analysis for Science Applications International
Science Applications International's Dividend Is Well Covered By Earnings
If it is predictable over a long period, even low dividend yields can be attractive. However, Science Applications International's earnings easily cover the dividend. As a result, a large proportion of what it earned was being reinvested back into the business.
Looking forward, earnings per share is forecast to fall by 10.6% over the next year. Assuming the dividend continues along recent trends, we believe the payout ratio could be 20%, which we are pretty comfortable with and we think is feasible on an earnings basis.
Science Applications International Has A Solid Track Record
The company has a sustained record of paying dividends with very little fluctuation. The annual payment during the last 10 years was $1.12 in 2014, and the most recent fiscal year payment was $1.48. This works out to be a compound annual growth rate (CAGR) of approximately 2.8% a year over that time. Dividends have grown relatively slowly, which is not great, but some investors may value the relative consistency of the dividend.
The Dividend Looks Likely To Grow
The company's investors will be pleased to have been receiving dividend income for some time. Science Applications International has seen EPS rising for the last five years, at 24% per annum. A low payout ratio gives the company a lot of flexibility, and growing earnings also make it very easy for it to grow the dividend.
Science Applications International Looks Like A Great Dividend Stock
In summary, it is good to see that the dividend is staying consistent, and we don't think there is any reason to suspect this might change over the medium term. The earnings easily cover the company's distributions, and the company is generating plenty of cash. If earnings do fall over the next 12 months, the dividend could be buffeted a little bit, but we don't think it should cause too much of a problem in the long term. All in all, this checks a lot of the boxes we look for when choosing an income stock.
Market movements attest to how highly valued a consistent dividend policy is compared to one which is more unpredictable. However, there are other things to consider for investors when analysing stock performance. Just as an example, we've come across 3 warning signs for Science Applications International you should be aware of, and 2 of them are significant. If you are a dividend investor, you might also want to look at our curated list of high yield dividend stocks.
Have feedback on this article? Concerned about the content? Get in touch with us directly. Alternatively, email editorial-team (at) simplywallst.com.
This article by Simply Wall St is general in nature. We provide commentary based on historical data and analyst forecasts only using an unbiased methodology and our articles are not intended to be financial advice. It does not constitute a recommendation to buy or sell any stock, and does not take account of your objectives, or your financial situation. We aim to bring you long-term focused analysis driven by fundamental data. Note that our analysis may not factor in the latest price-sensitive company announcements or qualitative material. Simply Wall St has no position in any stocks mentioned.
Have feedback on this article? Concerned about the content? Get in touch with us directly. Alternatively, email editorial-team@simplywallst.com
