
 Yahoo Finance
 Select Water Solutions (NYSE:WTTR) delivers shareholders notable 21% CAGR over 3 years, surging 5.4% in the last week alone
By buying an index fund, investors can approximate the average market return. But if you pick the right individual stocks, you could make more than that. For example, Select Water Solutions, Inc. (NYSE:WTTR) shareholders have seen the share price rise 69% over three years, well in excess of the market return (14%, not including dividends). On the other hand, the returns haven't been quite so good recently, with shareholders up just 38%, including dividends.
Since the stock has added US$56m to its market cap in the past week alone, let's see if underlying performance has been driving long-term returns.
See our latest analysis for Select Water Solutions
There is no denying that markets are sometimes efficient, but prices do not always reflect underlying business performance. One imperfect but simple way to consider how the market perception of a company has shifted is to compare the change in the earnings per share (EPS) with the share price movement.
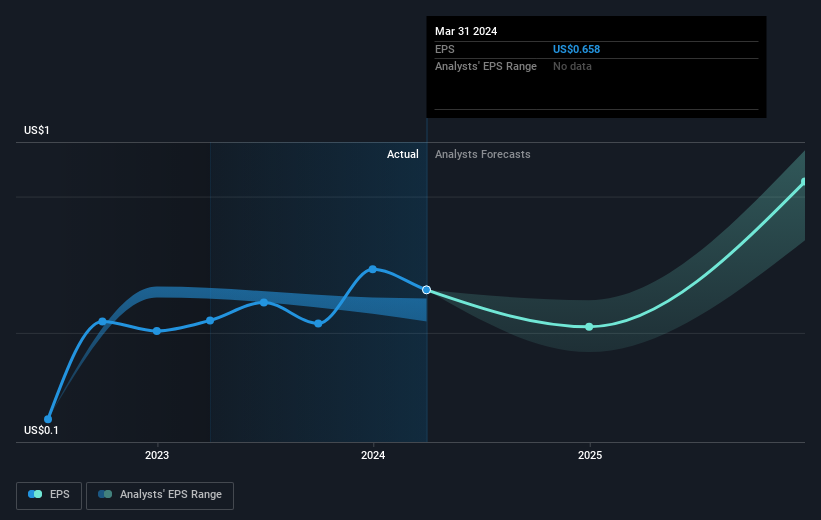
During three years of share price growth, Select Water Solutions moved from a loss to profitability. So we would expect a higher share price over the period.
The image below shows how EPS has tracked over time (if you click on the image you can see greater detail).
We know that Select Water Solutions has improved its bottom line over the last three years, but what does the future have in store? This free interactive report on Select Water Solutions' balance sheet strength is a great place to start, if you want to investigate the stock further.
What About Dividends?
When looking at investment returns, it is important to consider the difference between total shareholder return (TSR) and share price return. The TSR is a return calculation that accounts for the value of cash dividends (assuming that any dividend received was reinvested) and the calculated value of any discounted capital raisings and spin-offs. Arguably, the TSR gives a more comprehensive picture of the return generated by a stock. In the case of Select Water Solutions, it has a TSR of 78% for the last 3 years. That exceeds its share price return that we previously mentioned. This is largely a result of its dividend payments!
A Different Perspective
It's good to see that Select Water Solutions has rewarded shareholders with a total shareholder return of 38% in the last twelve months. That's including the dividend. Notably the five-year annualised TSR loss of 1.3% per year compares very unfavourably with the recent share price performance. The long term loss makes us cautious, but the short term TSR gain certainly hints at a brighter future. It's always interesting to track share price performance over the longer term. But to understand Select Water Solutions better, we need to consider many other factors. Even so, be aware that Select Water Solutions is showing 2 warning signs in our investment analysis , you should know about...
For those who like to find winning investments this free list of undervalued companies with recent insider purchasing, could be just the ticket.
Please note, the market returns quoted in this article reflect the market weighted average returns of stocks that currently trade on American exchanges.
Have feedback on this article? Concerned about the content? Get in touch with us directly. Alternatively, email editorial-team (at) simplywallst.com.
This article by Simply Wall St is general in nature. We provide commentary based on historical data and analyst forecasts only using an unbiased methodology and our articles are not intended to be financial advice. It does not constitute a recommendation to buy or sell any stock, and does not take account of your objectives, or your financial situation. We aim to bring you long-term focused analysis driven by fundamental data. Note that our analysis may not factor in the latest price-sensitive company announcements or qualitative material. Simply Wall St has no position in any stocks mentioned.
