
 Yahoo Finance
 Shareholders in Corbion (AMS:CRBN) are in the red if they invested three years ago
The truth is that if you invest for long enough, you're going to end up with some losing stocks. But the long term shareholders of Corbion N.V. (AMS:CRBN) have had an unfortunate run in the last three years. So they might be feeling emotional about the 61% share price collapse, in that time. Unfortunately the share price momentum is still quite negative, with prices down 11% in thirty days.
Since shareholders are down over the longer term, lets look at the underlying fundamentals over the that time and see if they've been consistent with returns.
View our latest analysis for Corbion
In his essay The Superinvestors of Graham-and-Doddsville Warren Buffett described how share prices do not always rationally reflect the value of a business. One flawed but reasonable way to assess how sentiment around a company has changed is to compare the earnings per share (EPS) with the share price.
Corbion saw its EPS decline at a compound rate of 0.2% per year, over the last three years. This reduction in EPS is slower than the 27% annual reduction in the share price. So it seems the market was too confident about the business, in the past.
The image below shows how EPS has tracked over time (if you click on the image you can see greater detail).
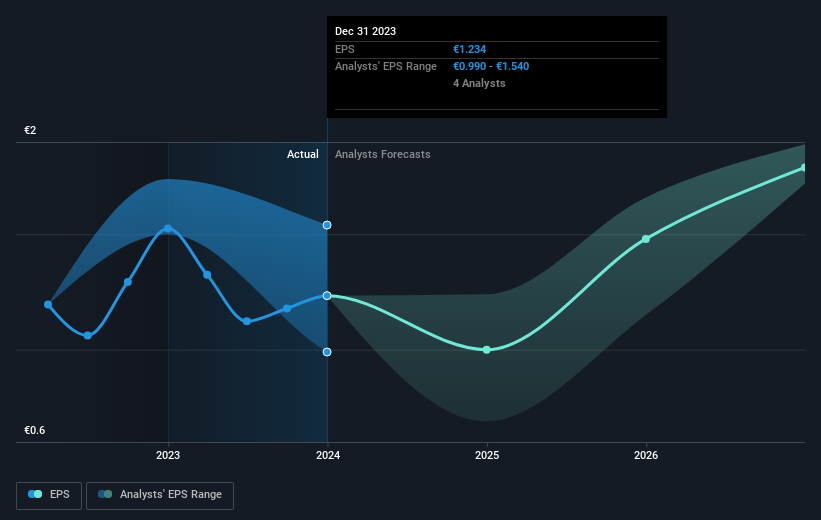
It might be well worthwhile taking a look at our free report on Corbion's earnings, revenue and cash flow.
What About Dividends?
It is important to consider the total shareholder return, as well as the share price return, for any given stock. The TSR incorporates the value of any spin-offs or discounted capital raisings, along with any dividends, based on the assumption that the dividends are reinvested. So for companies that pay a generous dividend, the TSR is often a lot higher than the share price return. We note that for Corbion the TSR over the last 3 years was -58%, which is better than the share price return mentioned above. This is largely a result of its dividend payments!
A Different Perspective
Investors in Corbion had a tough year, with a total loss of 10% (including dividends), against a market gain of about 25%. Even the share prices of good stocks drop sometimes, but we want to see improvements in the fundamental metrics of a business, before getting too interested. Unfortunately, last year's performance may indicate unresolved challenges, given that it was worse than the annualised loss of 5% over the last half decade. We realise that Baron Rothschild has said investors should "buy when there is blood on the streets", but we caution that investors should first be sure they are buying a high quality business. While it is well worth considering the different impacts that market conditions can have on the share price, there are other factors that are even more important. Case in point: We've spotted 2 warning signs for Corbion you should be aware of.
If you like to buy stocks alongside management, then you might just love this free list of companies. (Hint: many of them are unnoticed AND have attractive valuation).
Please note, the market returns quoted in this article reflect the market weighted average returns of stocks that currently trade on Dutch exchanges.
Have feedback on this article? Concerned about the content? Get in touch with us directly. Alternatively, email editorial-team (at) simplywallst.com.
This article by Simply Wall St is general in nature. We provide commentary based on historical data and analyst forecasts only using an unbiased methodology and our articles are not intended to be financial advice. It does not constitute a recommendation to buy or sell any stock, and does not take account of your objectives, or your financial situation. We aim to bring you long-term focused analysis driven by fundamental data. Note that our analysis may not factor in the latest price-sensitive company announcements or qualitative material. Simply Wall St has no position in any stocks mentioned.
Have feedback on this article? Concerned about the content? Get in touch with us directly. Alternatively, email editorial-team@simplywallst.com
