
 Yahoo Finance
 Shareholders in CytomX Therapeutics (NASDAQ:CTMX) are in the red if they invested five years ago
We're definitely into long term investing, but some companies are simply bad investments over any time frame. We really hate to see fellow investors lose their hard-earned money. Spare a thought for those who held CytomX Therapeutics, Inc. (NASDAQ:CTMX) for five whole years - as the share price tanked 83%. Unfortunately the share price momentum is still quite negative, with prices down 62% in thirty days. We really hope anyone holding through that price crash has a diversified portfolio. Even when you lose money, you don't have to lose the lesson.
With that in mind, it's worth seeing if the company's underlying fundamentals have been the driver of long term performance, or if there are some discrepancies.
View our latest analysis for CytomX Therapeutics
There is no denying that markets are sometimes efficient, but prices do not always reflect underlying business performance. One flawed but reasonable way to assess how sentiment around a company has changed is to compare the earnings per share (EPS) with the share price.
During five years of share price growth, CytomX Therapeutics moved from a loss to profitability. Most would consider that to be a good thing, so it's counter-intuitive to see the share price declining. Other metrics may better explain the share price move.
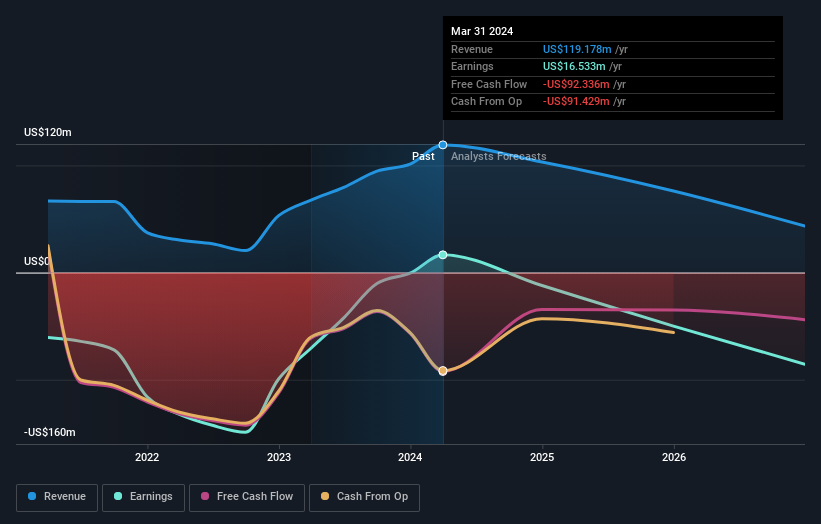
Revenue is actually up 5.5% over the time period. A more detailed examination of the revenue and earnings may or may not explain why the share price languishes; there could be an opportunity.
You can see below how earnings and revenue have changed over time (discover the exact values by clicking on the image).
It is of course excellent to see how CytomX Therapeutics has grown profits over the years, but the future is more important for shareholders. It might be well worthwhile taking a look at our free report on how its financial position has changed over time.
A Different Perspective
CytomX Therapeutics shareholders are down 0.6% for the year, but the market itself is up 24%. However, keep in mind that even the best stocks will sometimes underperform the market over a twelve month period. However, the loss over the last year isn't as bad as the 13% per annum loss investors have suffered over the last half decade. We'd need to see some sustained improvements in the key metrics before we could muster much enthusiasm. It's always interesting to track share price performance over the longer term. But to understand CytomX Therapeutics better, we need to consider many other factors. For instance, we've identified 5 warning signs for CytomX Therapeutics (3 are a bit concerning) that you should be aware of.
But note: CytomX Therapeutics may not be the best stock to buy. So take a peek at this free list of interesting companies with past earnings growth (and further growth forecast).
Please note, the market returns quoted in this article reflect the market weighted average returns of stocks that currently trade on American exchanges.
Have feedback on this article? Concerned about the content? Get in touch with us directly. Alternatively, email editorial-team (at) simplywallst.com.
This article by Simply Wall St is general in nature. We provide commentary based on historical data and analyst forecasts only using an unbiased methodology and our articles are not intended to be financial advice. It does not constitute a recommendation to buy or sell any stock, and does not take account of your objectives, or your financial situation. We aim to bring you long-term focused analysis driven by fundamental data. Note that our analysis may not factor in the latest price-sensitive company announcements or qualitative material. Simply Wall St has no position in any stocks mentioned.
