
 Yahoo Finance
 Shareholders Would Enjoy A Repeat Of Pan African Resources' (LON:PAF) Recent Growth In Returns
If we want to find a stock that could multiply over the long term, what are the underlying trends we should look for? Firstly, we'd want to identify a growing return on capital employed (ROCE) and then alongside that, an ever-increasing base of capital employed. Put simply, these types of businesses are compounding machines, meaning they are continually reinvesting their earnings at ever-higher rates of return. With that in mind, the ROCE of Pan African Resources (LON:PAF) looks great, so lets see what the trend can tell us.
Understanding Return On Capital Employed (ROCE)
For those who don't know, ROCE is a measure of a company's yearly pre-tax profit (its return), relative to the capital employed in the business. To calculate this metric for Pan African Resources, this is the formula:
Return on Capital Employed = Earnings Before Interest and Tax (EBIT) ÷ (Total Assets - Current Liabilities)
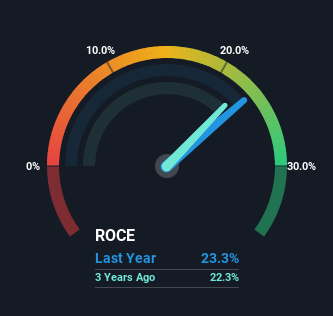
0.23 = US$98m ÷ (US$501m - US$77m) (Based on the trailing twelve months to June 2023).
Thus, Pan African Resources has an ROCE of 23%. That's a fantastic return and not only that, it outpaces the average of 9.2% earned by companies in a similar industry.
View our latest analysis for Pan African Resources
In the above chart we have measured Pan African Resources' prior ROCE against its prior performance, but the future is arguably more important. If you're interested, you can view the analysts predictions in our free report on analyst forecasts for the company.
What Does the ROCE Trend For Pan African Resources Tell Us?
Pan African Resources is displaying some positive trends. The data shows that returns on capital have increased substantially over the last five years to 23%. Basically the business is earning more per dollar of capital invested and in addition to that, 41% more capital is being employed now too. This can indicate that there's plenty of opportunities to invest capital internally and at ever higher rates, a combination that's common among multi-baggers.
What We Can Learn From Pan African Resources' ROCE
All in all, it's terrific to see that Pan African Resources is reaping the rewards from prior investments and is growing its capital base. And investors seem to expect more of this going forward, since the stock has rewarded shareholders with a 94% return over the last five years. So given the stock has proven it has promising trends, it's worth researching the company further to see if these trends are likely to persist.
On a separate note, we've found 1 warning sign for Pan African Resources you'll probably want to know about.
If you'd like to see other companies earning high returns, check out our free list of companies earning high returns with solid balance sheets here.
Have feedback on this article? Concerned about the content? Get in touch with us directly. Alternatively, email editorial-team (at) simplywallst.com.
This article by Simply Wall St is general in nature. We provide commentary based on historical data and analyst forecasts only using an unbiased methodology and our articles are not intended to be financial advice. It does not constitute a recommendation to buy or sell any stock, and does not take account of your objectives, or your financial situation. We aim to bring you long-term focused analysis driven by fundamental data. Note that our analysis may not factor in the latest price-sensitive company announcements or qualitative material. Simply Wall St has no position in any stocks mentioned.
