
 Yahoo Finance
 Shareholders in Hain Celestial Group (NASDAQ:HAIN) are in the red if they invested three years ago
As an investor its worth striving to ensure your overall portfolio beats the market average. But in any portfolio, there are likely to be some stocks that fall short of that benchmark. Unfortunately, that's been the case for longer term The Hain Celestial Group, Inc. (NASDAQ:HAIN) shareholders, since the share price is down 42% in the last three years, falling well short of the market return of around 44%. And over the last year the share price fell 34%, so we doubt many shareholders are delighted. Furthermore, it's down 17% in about a quarter. That's not much fun for holders.
With that in mind, it's worth seeing if the company's underlying fundamentals have been the driver of long term performance, or if there are some discrepancies.
Check out our latest analysis for Hain Celestial Group
To quote Buffett, 'Ships will sail around the world but the Flat Earth Society will flourish. There will continue to be wide discrepancies between price and value in the marketplace...' By comparing earnings per share (EPS) and share price changes over time, we can get a feel for how investor attitudes to a company have morphed over time.
During five years of share price growth, Hain Celestial Group moved from a loss to profitability. That would generally be considered a positive, so we are surprised to see the share price is down. So it's worth looking at other metrics to try to understand the share price move.
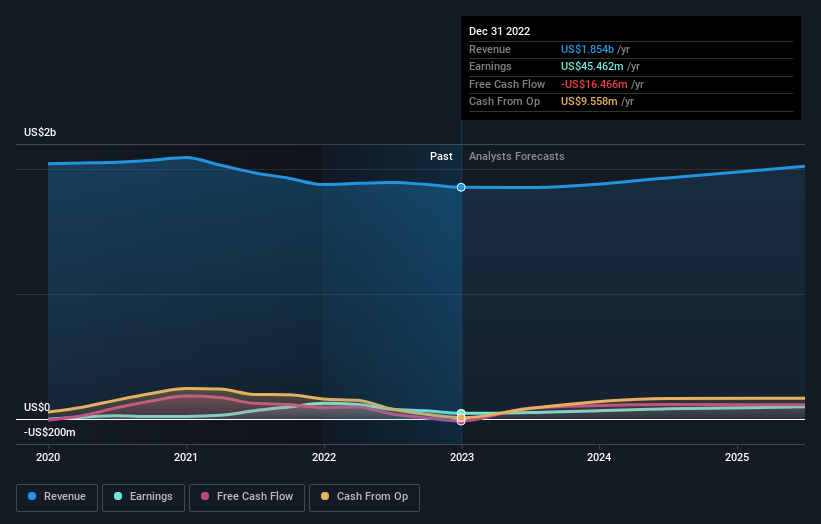
We think that the revenue decline over three years, at a rate of 4.2% per year, probably had some shareholders looking to sell. After all, if revenue keeps shrinking, it may be difficult to find earnings growth in the future.
The image below shows how earnings and revenue have tracked over time (if you click on the image you can see greater detail).
Hain Celestial Group is well known by investors, and plenty of clever analysts have tried to predict the future profit levels. If you are thinking of buying or selling Hain Celestial Group stock, you should check out this free report showing analyst consensus estimates for future profits.
A Different Perspective
Investors in Hain Celestial Group had a tough year, with a total loss of 34%, against a market gain of about 4.4%. Even the share prices of good stocks drop sometimes, but we want to see improvements in the fundamental metrics of a business, before getting too interested. Regrettably, last year's performance caps off a bad run, with the shareholders facing a total loss of 6% per year over five years. Generally speaking long term share price weakness can be a bad sign, though contrarian investors might want to research the stock in hope of a turnaround. I find it very interesting to look at share price over the long term as a proxy for business performance. But to truly gain insight, we need to consider other information, too. For instance, we've identified 3 warning signs for Hain Celestial Group (1 is potentially serious) that you should be aware of.
For those who like to find winning investments this free list of growing companies with recent insider purchasing, could be just the ticket.
Please note, the market returns quoted in this article reflect the market weighted average returns of stocks that currently trade on American exchanges.
Have feedback on this article? Concerned about the content? Get in touch with us directly. Alternatively, email editorial-team (at) simplywallst.com.
This article by Simply Wall St is general in nature. We provide commentary based on historical data and analyst forecasts only using an unbiased methodology and our articles are not intended to be financial advice. It does not constitute a recommendation to buy or sell any stock, and does not take account of your objectives, or your financial situation. We aim to bring you long-term focused analysis driven by fundamental data. Note that our analysis may not factor in the latest price-sensitive company announcements or qualitative material. Simply Wall St has no position in any stocks mentioned.
Join A Paid User Research Session
You’ll receive a US$30 Amazon Gift card for 1 hour of your time while helping us build better investing tools for the individual investors like yourself. Sign up here
