
 Yahoo Finance
 Shareholders in JD.com (NASDAQ:JD) are in the red if they invested three years ago
JD.com, Inc. (NASDAQ:JD) shareholders should be happy to see the share price up 13% in the last month. Meanwhile over the last three years the stock has dropped hard. Regrettably, the share price slid 68% in that period. So it is really good to see an improvement. The rise has some hopeful, but turnarounds are often precarious.
It's worthwhile assessing if the company's economics have been moving in lockstep with these underwhelming shareholder returns, or if there is some disparity between the two. So let's do just that.
See our latest analysis for JD.com
While the efficient markets hypothesis continues to be taught by some, it has been proven that markets are over-reactive dynamic systems, and investors are not always rational. One imperfect but simple way to consider how the market perception of a company has shifted is to compare the change in the earnings per share (EPS) with the share price movement.
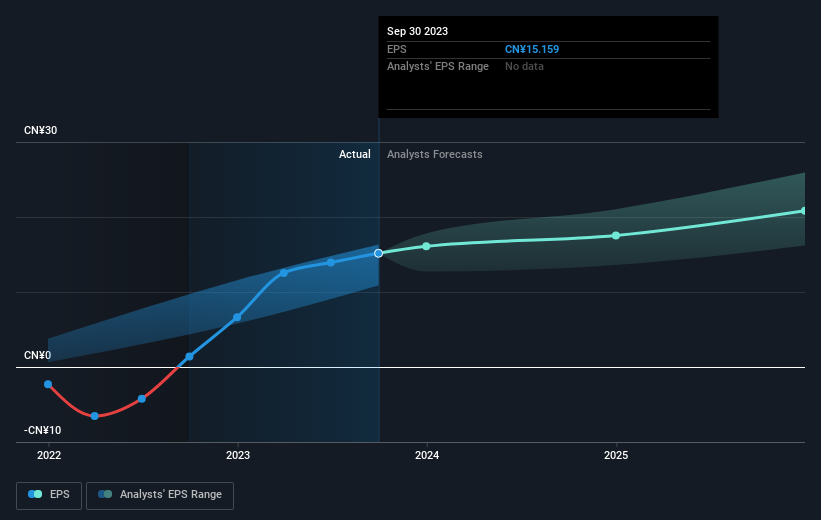
JD.com saw its EPS decline at a compound rate of 7.8% per year, over the last three years. The share price decline of 32% is actually steeper than the EPS slippage. So it's likely that the EPS decline has disappointed the market, leaving investors hesitant to buy.
You can see how EPS has changed over time in the image below (click on the chart to see the exact values).
We know that JD.com has improved its bottom line lately, but is it going to grow revenue? Check if analysts think JD.com will grow revenue in the future.
A Different Perspective
Investors in JD.com had a tough year, with a total loss of 42% (including dividends), against a market gain of about 14%. However, keep in mind that even the best stocks will sometimes underperform the market over a twelve month period. On the bright side, long term shareholders have made money, with a gain of 7% per year over half a decade. If the fundamental data continues to indicate long term sustainable growth, the current sell-off could be an opportunity worth considering. I find it very interesting to look at share price over the long term as a proxy for business performance. But to truly gain insight, we need to consider other information, too. Consider for instance, the ever-present spectre of investment risk. We've identified 1 warning sign with JD.com , and understanding them should be part of your investment process.
Of course JD.com may not be the best stock to buy. So you may wish to see this free collection of growth stocks.
Please note, the market returns quoted in this article reflect the market weighted average returns of stocks that currently trade on American exchanges.
Have feedback on this article? Concerned about the content? Get in touch with us directly. Alternatively, email editorial-team (at) simplywallst.com.
This article by Simply Wall St is general in nature. We provide commentary based on historical data and analyst forecasts only using an unbiased methodology and our articles are not intended to be financial advice. It does not constitute a recommendation to buy or sell any stock, and does not take account of your objectives, or your financial situation. We aim to bring you long-term focused analysis driven by fundamental data. Note that our analysis may not factor in the latest price-sensitive company announcements or qualitative material. Simply Wall St has no position in any stocks mentioned.
