
 Yahoo Finance
 Shareholders Are Optimistic That IDEXX Laboratories (NASDAQ:IDXX) Will Multiply In Value
If you're looking for a multi-bagger, there's a few things to keep an eye out for. Ideally, a business will show two trends; firstly a growing return on capital employed (ROCE) and secondly, an increasing amount of capital employed. Ultimately, this demonstrates that it's a business that is reinvesting profits at increasing rates of return. Ergo, when we looked at the ROCE trends at IDEXX Laboratories (NASDAQ:IDXX), we liked what we saw.
What Is Return On Capital Employed (ROCE)?
Just to clarify if you're unsure, ROCE is a metric for evaluating how much pre-tax income (in percentage terms) a company earns on the capital invested in its business. Analysts use this formula to calculate it for IDEXX Laboratories:
Return on Capital Employed = Earnings Before Interest and Tax (EBIT) ÷ (Total Assets - Current Liabilities)
0.47 = US$1.1b ÷ (US$3.4b - US$957m) (Based on the trailing twelve months to March 2024).
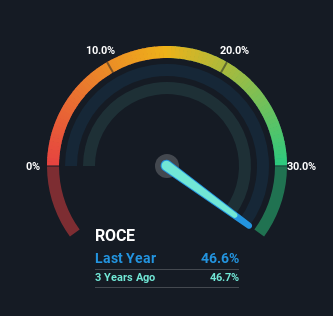
Therefore, IDEXX Laboratories has an ROCE of 47%. That's a fantastic return and not only that, it outpaces the average of 10% earned by companies in a similar industry.
See our latest analysis for IDEXX Laboratories
In the above chart we have measured IDEXX Laboratories' prior ROCE against its prior performance, but the future is arguably more important. If you'd like, you can check out the forecasts from the analysts covering IDEXX Laboratories for free.
So How Is IDEXX Laboratories' ROCE Trending?
We'd be pretty happy with returns on capital like IDEXX Laboratories. Over the past five years, ROCE has remained relatively flat at around 47% and the business has deployed 142% more capital into its operations. Now considering ROCE is an attractive 47%, this combination is actually pretty appealing because it means the business can consistently put money to work and generate these high returns. If IDEXX Laboratories can keep this up, we'd be very optimistic about its future.
On a side note, IDEXX Laboratories has done well to reduce current liabilities to 29% of total assets over the last five years. This can eliminate some of the risks inherent in the operations because the business has less outstanding obligations to their suppliers and or short-term creditors than they did previously.
Our Take On IDEXX Laboratories' ROCE
In summary, we're delighted to see that IDEXX Laboratories has been compounding returns by reinvesting at consistently high rates of return, as these are common traits of a multi-bagger. And since the stock has risen strongly over the last five years, it appears the market might expect this trend to continue. So while investors seem to be recognizing these promising trends, we still believe the stock deserves further research.
On the other side of ROCE, we have to consider valuation. That's why we have a FREE intrinsic value estimation for IDXX on our platform that is definitely worth checking out.
If you'd like to see other companies earning high returns, check out our free list of companies earning high returns with solid balance sheets here.
Have feedback on this article? Concerned about the content? Get in touch with us directly. Alternatively, email editorial-team (at) simplywallst.com.
This article by Simply Wall St is general in nature. We provide commentary based on historical data and analyst forecasts only using an unbiased methodology and our articles are not intended to be financial advice. It does not constitute a recommendation to buy or sell any stock, and does not take account of your objectives, or your financial situation. We aim to bring you long-term focused analysis driven by fundamental data. Note that our analysis may not factor in the latest price-sensitive company announcements or qualitative material. Simply Wall St has no position in any stocks mentioned.
Have feedback on this article? Concerned about the content? Get in touch with us directly. Alternatively, email editorial-team@simplywallst.com
