
 Yahoo Finance
 Shareholders in Petrofac (LON:PFC) are in the red if they invested five years ago
We think intelligent long term investing is the way to go. But unfortunately, some companies simply don't succeed. Zooming in on an example, the Petrofac Limited (LON:PFC) share price dropped 74% in the last half decade. That's not a lot of fun for true believers. Furthermore, it's down 22% in about a quarter. That's not much fun for holders.
Now let's have a look at the company's fundamentals, and see if the long term shareholder return has matched the performance of the underlying business.
See our latest analysis for Petrofac
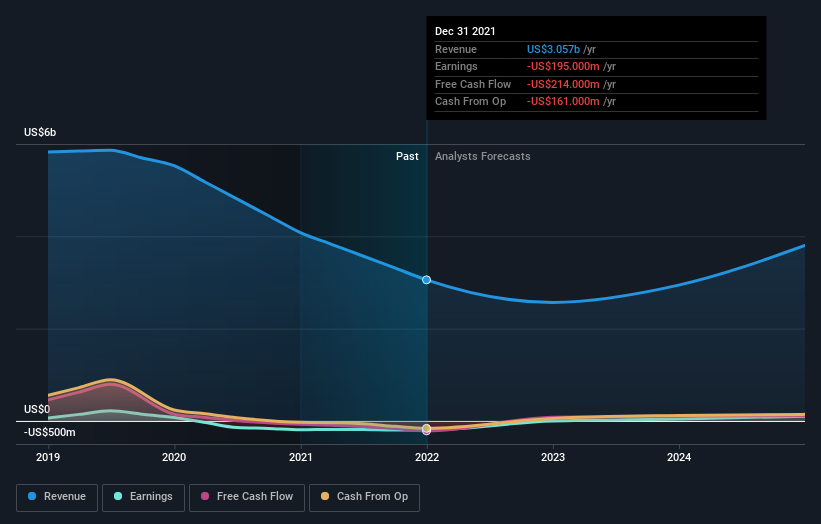
Petrofac wasn't profitable in the last twelve months, it is unlikely we'll see a strong correlation between its share price and its earnings per share (EPS). Arguably revenue is our next best option. When a company doesn't make profits, we'd generally expect to see good revenue growth. As you can imagine, fast revenue growth, when maintained, often leads to fast profit growth.
In the last five years Petrofac saw its revenue shrink by 16% per year. That puts it in an unattractive cohort, to put it mildly. So it's not altogether surprising to see the share price down 12% per year in the same time period. This kind of price performance makes us very wary, especially when combined with falling revenue. Ironically, that behavior could create an opportunity for the contrarian investor - but only if there are good reasons to predict a brighter future.
The company's revenue and earnings (over time) are depicted in the image below (click to see the exact numbers).
We like that insiders have been buying shares in the last twelve months. Having said that, most people consider earnings and revenue growth trends to be a more meaningful guide to the business. You can see what analysts are predicting for Petrofac in this interactive graph of future profit estimates.
What About The Total Shareholder Return (TSR)?
Investors should note that there's a difference between Petrofac's total shareholder return (TSR) and its share price change, which we've covered above. The TSR attempts to capture the value of dividends (as if they were reinvested) as well as any spin-offs or discounted capital raisings offered to shareholders. Dividends have been really beneficial for Petrofac shareholders, and that cash payout explains why its total shareholder loss of 69%, over the last 5 years, isn't as bad as the share price return.
A Different Perspective
It's good to see that Petrofac has rewarded shareholders with a total shareholder return of 12% in the last twelve months. There's no doubt those recent returns are much better than the TSR loss of 11% per year over five years. This makes us a little wary, but the business might have turned around its fortunes. While it is well worth considering the different impacts that market conditions can have on the share price, there are other factors that are even more important. Consider risks, for instance. Every company has them, and we've spotted 1 warning sign for Petrofac you should know about.
If you like to buy stocks alongside management, then you might just love this free list of companies. (Hint: insiders have been buying them).
Please note, the market returns quoted in this article reflect the market weighted average returns of stocks that currently trade on GB exchanges.
Have feedback on this article? Concerned about the content? Get in touch with us directly. Alternatively, email editorial-team (at) simplywallst.com.
This article by Simply Wall St is general in nature. We provide commentary based on historical data and analyst forecasts only using an unbiased methodology and our articles are not intended to be financial advice. It does not constitute a recommendation to buy or sell any stock, and does not take account of your objectives, or your financial situation. We aim to bring you long-term focused analysis driven by fundamental data. Note that our analysis may not factor in the latest price-sensitive company announcements or qualitative material. Simply Wall St has no position in any stocks mentioned.
Join A Paid User Research Session
You’ll receive a US$30 Amazon Gift card for 1 hour of your time while helping us build better investing tools for the individual investors like yourself. Sign up here
