
 Yahoo Finance
 Would Shareholders Who Purchased Rank Group's (LON:RNK) Stock Five Years Be Happy With The Share price Today?
The Rank Group Plc (LON:RNK) shareholders will doubtless be very grateful to see the share price up 39% in the last quarter. But over the last half decade, the stock has not performed well. You would have done a lot better buying an index fund, since the stock has dropped 18% in that half decade.
See our latest analysis for Rank Group
While markets are a powerful pricing mechanism, share prices reflect investor sentiment, not just underlying business performance. One way to examine how market sentiment has changed over time is to look at the interaction between a company's share price and its earnings per share (EPS).
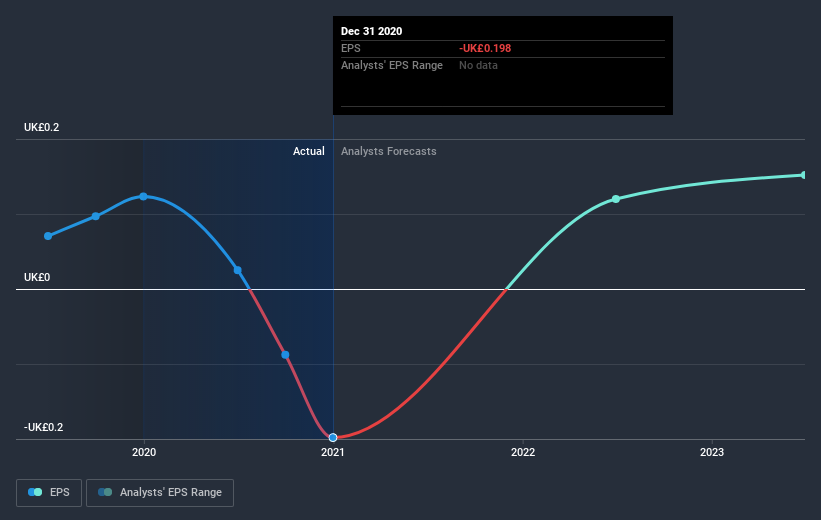
In the last half decade Rank Group saw its share price fall as its EPS declined below zero. Since the company has fallen to a loss making position, it's hard to compare the change in EPS with the share price change. However, we can say we'd expect to see a falling share price in this scenario.
The image below shows how EPS has tracked over time (if you click on the image you can see greater detail).
We consider it positive that insiders have made significant purchases in the last year. Having said that, most people consider earnings and revenue growth trends to be a more meaningful guide to the business. This free interactive report on Rank Group's earnings, revenue and cash flow is a great place to start, if you want to investigate the stock further.
What about the Total Shareholder Return (TSR)?
Investors should note that there's a difference between Rank Group's total shareholder return (TSR) and its share price change, which we've covered above. Arguably the TSR is a more complete return calculation because it accounts for the value of dividends (as if they were reinvested), along with the hypothetical value of any discounted capital that have been offered to shareholders. Rank Group's TSR of was a loss of 5.4% for the 5 years. That wasn't as bad as its share price return, because it has paid dividends.
A Different Perspective
Rank Group shareholders gained a total return of 17% during the year. But that was short of the market average. But at least that's still a gain! Over five years the TSR has been a reduction of 1.1% per year, over five years. So this might be a sign the business has turned its fortunes around. I find it very interesting to look at share price over the long term as a proxy for business performance. But to truly gain insight, we need to consider other information, too. Case in point: We've spotted 2 warning signs for Rank Group you should be aware of.
There are plenty of other companies that have insiders buying up shares. You probably do not want to miss this free list of growing companies that insiders are buying.
Please note, the market returns quoted in this article reflect the market weighted average returns of stocks that currently trade on GB exchanges.
This article by Simply Wall St is general in nature. It does not constitute a recommendation to buy or sell any stock, and does not take account of your objectives, or your financial situation. We aim to bring you long-term focused analysis driven by fundamental data. Note that our analysis may not factor in the latest price-sensitive company announcements or qualitative material. Simply Wall St has no position in any stocks mentioned.
Have feedback on this article? Concerned about the content? Get in touch with us directly. Alternatively, email editorial-team (at) simplywallst.com.
