
 Yahoo Finance
 Shareholders Are Raving About How The YouGov (LON:YOU) Share Price Increased 343%

Want to participate in a short research study? Help shape the future of investing tools and you could win a $250 gift card!
For many, the main point of investing in the stock market is to achieve spectacular returns. And we've seen some truly amazing gains over the years. Don't believe it? Then look at the YouGov plc (LON:YOU) share price. It's 343% higher than it was five years ago. If that doesn't get you thinking about long term investing, we don't know what will. It's also up 17% in about a month.
See our latest analysis for YouGov
To paraphrase Benjamin Graham: Over the short term the market is a voting machine, but over the long term it's a weighing machine. One way to examine how market sentiment has changed over time is to look at the interaction between a company's share price and its earnings per share (EPS).
Over half a decade, YouGov managed to grow its earnings per share at 47% a year. This EPS growth is higher than the 35% average annual increase in the share price. Therefore, it seems the market has become relatively pessimistic about the company.
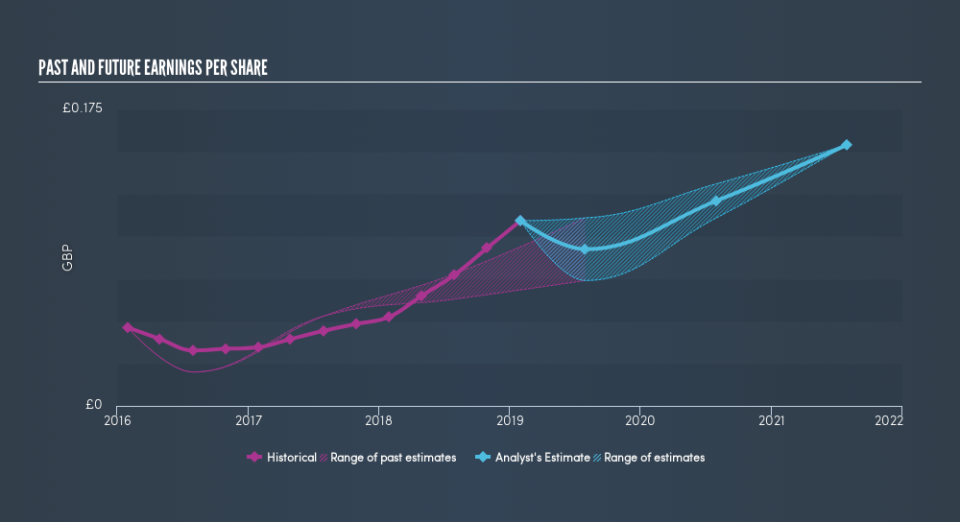
The company's earnings per share (over time) is depicted in the image below (click to see the exact numbers).
We like that insiders have been buying shares in the last twelve months. Even so, future earnings will be far more important to whether current shareholders make money. It might be well worthwhile taking a look at our free report on YouGov's earnings, revenue and cash flow.
What About Dividends?
When looking at investment returns, it is important to consider the difference between total shareholder return (TSR) and share price return. The TSR incorporates the value of any spin-offs or discounted capital raisings, along with any dividends, based on the assumption that the dividends are reinvested. So for companies that pay a generous dividend, the TSR is often a lot higher than the share price return. In the case of YouGov, it has a TSR of 357% for the last 5 years. That exceeds its share price return that we previously mentioned. And there's no prize for guessing that the dividend payments largely explain the divergence!
A Different Perspective
It's nice to see that YouGov shareholders have received a total shareholder return of 14% over the last year. Of course, that includes the dividend. However, that falls short of the 36% TSR per annum it has made for shareholders, each year, over five years. The pessimistic view would be that be that the stock has its best days behind it, but on the other hand the price might simply be moderating while the business itself continues to execute. Investors who like to make money usually check up on insider purchases, such as the price paid, and total amount bought. You can find out about the insider purchases of YouGov by clicking this link.
If you like to buy stocks alongside management, then you might just love this free list of companies. (Hint: insiders have been buying them).
Please note, the market returns quoted in this article reflect the market weighted average returns of stocks that currently trade on GB exchanges.
We aim to bring you long-term focused research analysis driven by fundamental data. Note that our analysis may not factor in the latest price-sensitive company announcements or qualitative material.
If you spot an error that warrants correction, please contact the editor at editorial-team@simplywallst.com. This article by Simply Wall St is general in nature. It does not constitute a recommendation to buy or sell any stock, and does not take account of your objectives, or your financial situation. Simply Wall St has no position in the stocks mentioned. Thank you for reading.
