
 Yahoo Finance
 Shareholders in Sabre Insurance Group (LON:SBRE) are in the red if they invested three years ago
Investing in stocks inevitably means buying into some companies that perform poorly. But the last three years have been particularly tough on longer term Sabre Insurance Group plc (LON:SBRE) shareholders. Regrettably, they have had to cope with a 69% drop in the share price over that period. And the ride hasn't got any smoother in recent times over the last year, with the price 53% lower in that time.
So let's have a look and see if the longer term performance of the company has been in line with the underlying business' progress.
See our latest analysis for Sabre Insurance Group
While markets are a powerful pricing mechanism, share prices reflect investor sentiment, not just underlying business performance. One flawed but reasonable way to assess how sentiment around a company has changed is to compare the earnings per share (EPS) with the share price.
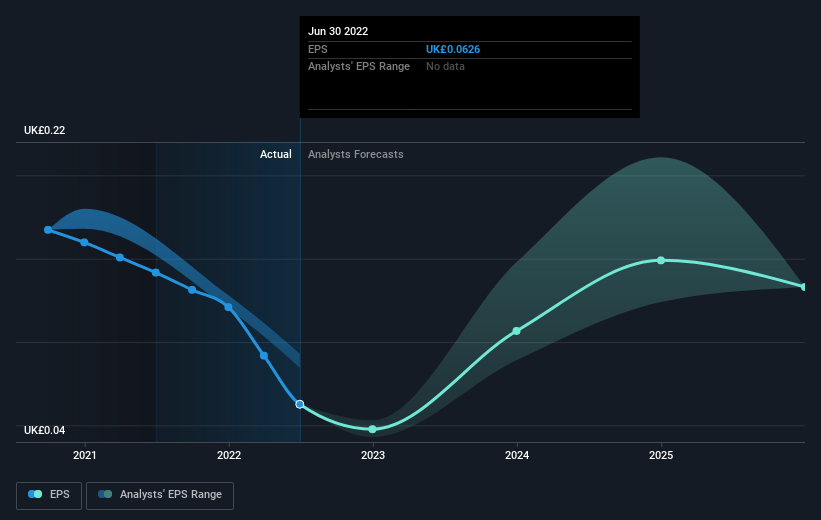
During the three years that the share price fell, Sabre Insurance Group's earnings per share (EPS) dropped by 31% each year. The 32% average annual share price decline is remarkably close to the EPS decline. So it seems like sentiment towards the stock hasn't changed all that much over time. In this case, it seems that the EPS is guiding the share price.
You can see how EPS has changed over time in the image below (click on the chart to see the exact values).
We consider it positive that insiders have made significant purchases in the last year. Even so, future earnings will be far more important to whether current shareholders make money. Dive deeper into the earnings by checking this interactive graph of Sabre Insurance Group's earnings, revenue and cash flow.
What About Dividends?
It is important to consider the total shareholder return, as well as the share price return, for any given stock. The TSR incorporates the value of any spin-offs or discounted capital raisings, along with any dividends, based on the assumption that the dividends are reinvested. So for companies that pay a generous dividend, the TSR is often a lot higher than the share price return. We note that for Sabre Insurance Group the TSR over the last 3 years was -62%, which is better than the share price return mentioned above. This is largely a result of its dividend payments!
A Different Perspective
While the broader market lost about 1.7% in the twelve months, Sabre Insurance Group shareholders did even worse, losing 50% (even including dividends). Having said that, it's inevitable that some stocks will be oversold in a falling market. The key is to keep your eyes on the fundamental developments. Regrettably, last year's performance caps off a bad run, with the shareholders facing a total loss of 9% per year over five years. Generally speaking long term share price weakness can be a bad sign, though contrarian investors might want to research the stock in hope of a turnaround. It's always interesting to track share price performance over the longer term. But to understand Sabre Insurance Group better, we need to consider many other factors. Take risks, for example - Sabre Insurance Group has 2 warning signs we think you should be aware of.
If you like to buy stocks alongside management, then you might just love this free list of companies. (Hint: insiders have been buying them).
Please note, the market returns quoted in this article reflect the market weighted average returns of stocks that currently trade on GB exchanges.
Have feedback on this article? Concerned about the content? Get in touch with us directly. Alternatively, email editorial-team (at) simplywallst.com.
This article by Simply Wall St is general in nature. We provide commentary based on historical data and analyst forecasts only using an unbiased methodology and our articles are not intended to be financial advice. It does not constitute a recommendation to buy or sell any stock, and does not take account of your objectives, or your financial situation. We aim to bring you long-term focused analysis driven by fundamental data. Note that our analysis may not factor in the latest price-sensitive company announcements or qualitative material. Simply Wall St has no position in any stocks mentioned.
Join A Paid User Research Session
You’ll receive a US$30 Amazon Gift card for 1 hour of your time while helping us build better investing tools for the individual investors like yourself. Sign up here
