
 Yahoo Finance
 Shareholders in Sandstorm Gold (TSE:SSL) are in the red if they invested three years ago
Sandstorm Gold Ltd. (TSE:SSL) shareholders should be happy to see the share price up 16% in the last quarter. But that doesn't change the fact that the returns over the last three years have been less than pleasing. In fact, the share price is down 23% in the last three years, falling well short of the market return.
It's worthwhile assessing if the company's economics have been moving in lockstep with these underwhelming shareholder returns, or if there is some disparity between the two. So let's do just that.
Check out our latest analysis for Sandstorm Gold
In his essay The Superinvestors of Graham-and-Doddsville Warren Buffett described how share prices do not always rationally reflect the value of a business. By comparing earnings per share (EPS) and share price changes over time, we can get a feel for how investor attitudes to a company have morphed over time.
During the unfortunate three years of share price decline, Sandstorm Gold actually saw its earnings per share (EPS) improve by 24% per year. This is quite a puzzle, and suggests there might be something temporarily buoying the share price. Alternatively, growth expectations may have been unreasonable in the past.
Since the change in EPS doesn't seem to correlate with the change in share price, it's worth taking a look at other metrics.
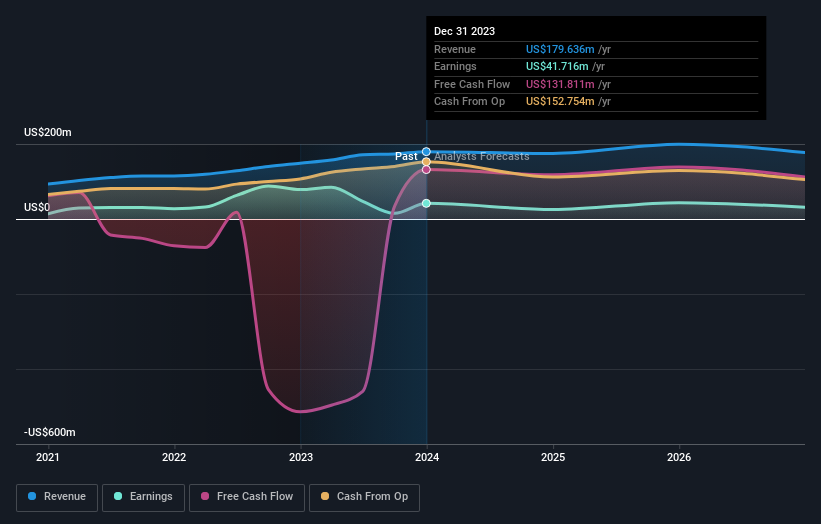
The modest 1.1% dividend yield is unlikely to be guiding the market view of the stock. We note that, in three years, revenue has actually grown at a 22% annual rate, so that doesn't seem to be a reason to sell shares. It's probably worth investigating Sandstorm Gold further; while we may be missing something on this analysis, there might also be an opportunity.
You can see below how earnings and revenue have changed over time (discover the exact values by clicking on the image).
It's probably worth noting we've seen significant insider buying in the last quarter, which we consider a positive. That said, we think earnings and revenue growth trends are even more important factors to consider. So it makes a lot of sense to check out what analysts think Sandstorm Gold will earn in the future (free profit forecasts).
What About Dividends?
When looking at investment returns, it is important to consider the difference between total shareholder return (TSR) and share price return. Whereas the share price return only reflects the change in the share price, the TSR includes the value of dividends (assuming they were reinvested) and the benefit of any discounted capital raising or spin-off. Arguably, the TSR gives a more comprehensive picture of the return generated by a stock. We note that for Sandstorm Gold the TSR over the last 3 years was -21%, which is better than the share price return mentioned above. And there's no prize for guessing that the dividend payments largely explain the divergence!
A Different Perspective
While the broader market gained around 10.0% in the last year, Sandstorm Gold shareholders lost 6.0% (even including dividends). However, keep in mind that even the best stocks will sometimes underperform the market over a twelve month period. On the bright side, long term shareholders have made money, with a gain of 1.5% per year over half a decade. If the fundamental data continues to indicate long term sustainable growth, the current sell-off could be an opportunity worth considering. I find it very interesting to look at share price over the long term as a proxy for business performance. But to truly gain insight, we need to consider other information, too. For instance, we've identified 3 warning signs for Sandstorm Gold (1 is significant) that you should be aware of.
If you like to buy stocks alongside management, then you might just love this free list of companies. (Hint: insiders have been buying them).
Please note, the market returns quoted in this article reflect the market weighted average returns of stocks that currently trade on Canadian exchanges.
Have feedback on this article? Concerned about the content? Get in touch with us directly. Alternatively, email editorial-team (at) simplywallst.com.
This article by Simply Wall St is general in nature. We provide commentary based on historical data and analyst forecasts only using an unbiased methodology and our articles are not intended to be financial advice. It does not constitute a recommendation to buy or sell any stock, and does not take account of your objectives, or your financial situation. We aim to bring you long-term focused analysis driven by fundamental data. Note that our analysis may not factor in the latest price-sensitive company announcements or qualitative material. Simply Wall St has no position in any stocks mentioned.
