
 Yahoo Finance
 Shareholders Of Strix Group (LON:KETL) Must Be Happy With Their 115% Total Return
One simple way to benefit from the stock market is to buy an index fund. But if you choose individual stocks with prowess, you can make superior returns. Just take a look at Strix Group Plc (LON:KETL), which is up 91%, over three years, soundly beating the market return of 1.1% (not including dividends). On the other hand, the returns haven't been quite so good recently, with shareholders up just 72% , including dividends .
See our latest analysis for Strix Group
In his essay The Superinvestors of Graham-and-Doddsville Warren Buffett described how share prices do not always rationally reflect the value of a business. One flawed but reasonable way to assess how sentiment around a company has changed is to compare the earnings per share (EPS) with the share price.
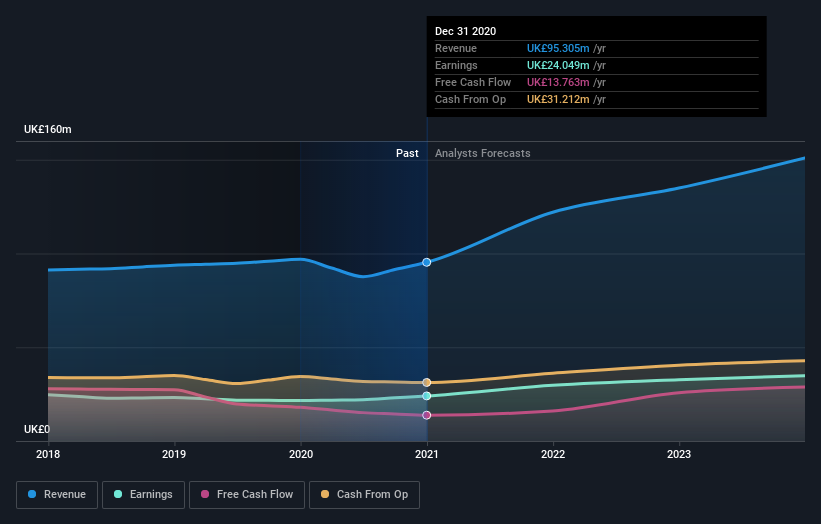
During the three years of share price growth, Strix Group actually saw its earnings per share (EPS) drop 2.1% per year.
Given the share price resilience, we don't think the (declining) EPS numbers are a good measure of how the business is moving forward, right now. So other metrics may hold the key to understanding what is influencing investors.
We severely doubt anyone is particularly impressed with the modest 0.3% three-year revenue growth rate. So truth be told we can't see an easy explanation for the share price action, but perhaps you can...
The image below shows how earnings and revenue have tracked over time (if you click on the image you can see greater detail).
Balance sheet strength is crucial. It might be well worthwhile taking a look at our free report on how its financial position has changed over time.
What About Dividends?
When looking at investment returns, it is important to consider the difference between total shareholder return (TSR) and share price return. The TSR is a return calculation that accounts for the value of cash dividends (assuming that any dividend received was reinvested) and the calculated value of any discounted capital raisings and spin-offs. So for companies that pay a generous dividend, the TSR is often a lot higher than the share price return. In the case of Strix Group, it has a TSR of 115% for the last 3 years. That exceeds its share price return that we previously mentioned. The dividends paid by the company have thusly boosted the total shareholder return.
A Different Perspective
Pleasingly, Strix Group's total shareholder return last year was 72%. That's including the dividend. So this year's TSR was actually better than the three-year TSR (annualized) of 29%. These improved returns may hint at some real business momentum, implying that now could be a great time to delve deeper. I find it very interesting to look at share price over the long term as a proxy for business performance. But to truly gain insight, we need to consider other information, too. Like risks, for instance. Every company has them, and we've spotted 4 warning signs for Strix Group (of which 1 shouldn't be ignored!) you should know about.
But note: Strix Group may not be the best stock to buy. So take a peek at this free list of interesting companies with past earnings growth (and further growth forecast).
Please note, the market returns quoted in this article reflect the market weighted average returns of stocks that currently trade on GB exchanges.
This article by Simply Wall St is general in nature. It does not constitute a recommendation to buy or sell any stock, and does not take account of your objectives, or your financial situation. We aim to bring you long-term focused analysis driven by fundamental data. Note that our analysis may not factor in the latest price-sensitive company announcements or qualitative material. Simply Wall St has no position in any stocks mentioned.
Have feedback on this article? Concerned about the content? Get in touch with us directly. Alternatively, email editorial-team (at) simplywallst.com.
