
 Yahoo Finance
 Sime Darby Property Berhad (KLSE:SIMEPROP) stock performs better than its underlying earnings growth over last year
When you buy shares in a company, there is always a risk that the price drops to zero. But if you pick the right stock, you can make a lot more than 100%. For example, the Sime Darby Property Berhad (KLSE:SIMEPROP) share price has soared 203% return in just a single year. Also pleasing for shareholders was the 70% gain in the last three months. And shareholders have also done well over the long term, with an increase of 129% in the last three years.
The past week has proven to be lucrative for Sime Darby Property Berhad investors, so let's see if fundamentals drove the company's one-year performance.
See our latest analysis for Sime Darby Property Berhad
While markets are a powerful pricing mechanism, share prices reflect investor sentiment, not just underlying business performance. One flawed but reasonable way to assess how sentiment around a company has changed is to compare the earnings per share (EPS) with the share price.
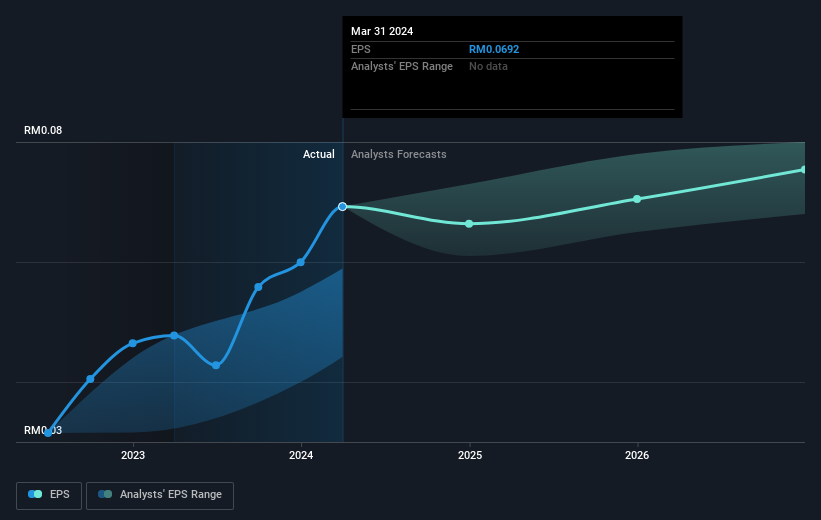
Sime Darby Property Berhad was able to grow EPS by 45% in the last twelve months. This EPS growth is significantly lower than the 203% increase in the share price. So it's fair to assume the market has a higher opinion of the business than it a year ago.
You can see how EPS has changed over time in the image below (click on the chart to see the exact values).
We know that Sime Darby Property Berhad has improved its bottom line over the last three years, but what does the future have in store? You can see how its balance sheet has strengthened (or weakened) over time in this free interactive graphic.
What About Dividends?
When looking at investment returns, it is important to consider the difference between total shareholder return (TSR) and share price return. The TSR incorporates the value of any spin-offs or discounted capital raisings, along with any dividends, based on the assumption that the dividends are reinvested. It's fair to say that the TSR gives a more complete picture for stocks that pay a dividend. As it happens, Sime Darby Property Berhad's TSR for the last 1 year was 212%, which exceeds the share price return mentioned earlier. The dividends paid by the company have thusly boosted the total shareholder return.
A Different Perspective
We're pleased to report that Sime Darby Property Berhad shareholders have received a total shareholder return of 212% over one year. Of course, that includes the dividend. Since the one-year TSR is better than the five-year TSR (the latter coming in at 9% per year), it would seem that the stock's performance has improved in recent times. Someone with an optimistic perspective could view the recent improvement in TSR as indicating that the business itself is getting better with time. It's always interesting to track share price performance over the longer term. But to understand Sime Darby Property Berhad better, we need to consider many other factors. For example, we've discovered 1 warning sign for Sime Darby Property Berhad that you should be aware of before investing here.
But note: Sime Darby Property Berhad may not be the best stock to buy. So take a peek at this free list of interesting companies with past earnings growth (and further growth forecast).
Please note, the market returns quoted in this article reflect the market weighted average returns of stocks that currently trade on Malaysian exchanges.
Have feedback on this article? Concerned about the content? Get in touch with us directly. Alternatively, email editorial-team (at) simplywallst.com.
This article by Simply Wall St is general in nature. We provide commentary based on historical data and analyst forecasts only using an unbiased methodology and our articles are not intended to be financial advice. It does not constitute a recommendation to buy or sell any stock, and does not take account of your objectives, or your financial situation. We aim to bring you long-term focused analysis driven by fundamental data. Note that our analysis may not factor in the latest price-sensitive company announcements or qualitative material. Simply Wall St has no position in any stocks mentioned.
Have feedback on this article? Concerned about the content? Get in touch with us directly. Alternatively, email editorial-team@simplywallst.com
