
 Yahoo Finance
 Simply Better Brands Corp. (CVE:SBBC) Could Be Riskier Than It Looks
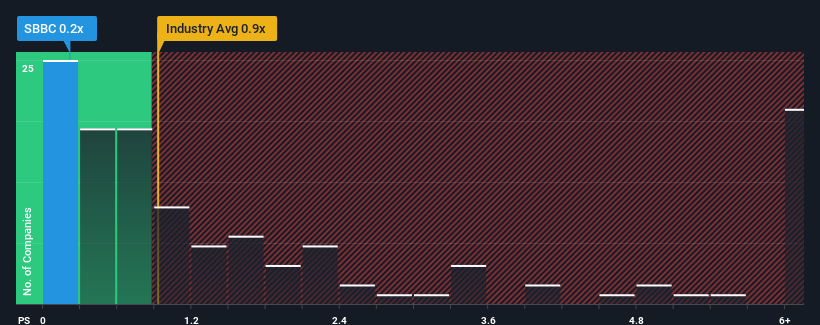
You may think that with a price-to-sales (or "P/S") ratio of 0.2x Simply Better Brands Corp. (CVE:SBBC) is a stock worth checking out, seeing as almost half of all the Pharmaceuticals companies in Canada have P/S ratios greater than 0.9x and even P/S higher than 3x aren't out of the ordinary. Nonetheless, we'd need to dig a little deeper to determine if there is a rational basis for the reduced P/S.
Check out our latest analysis for Simply Better Brands
How Simply Better Brands Has Been Performing
With revenue growth that's exceedingly strong of late, Simply Better Brands has been doing very well. It might be that many expect the strong revenue performance to degrade substantially, which has repressed the P/S ratio. If you like the company, you'd be hoping this isn't the case so that you could potentially pick up some stock while it's out of favour.
Although there are no analyst estimates available for Simply Better Brands, take a look at this free data-rich visualisation to see how the company stacks up on earnings, revenue and cash flow.
How Is Simply Better Brands' Revenue Growth Trending?
Simply Better Brands' P/S ratio would be typical for a company that's only expected to deliver limited growth, and importantly, perform worse than the industry.
If we review the last year of revenue growth, the company posted a terrific increase of 209%. Pleasingly, revenue has also lifted 257% in aggregate from three years ago, thanks to the last 12 months of growth. Accordingly, shareholders would have definitely welcomed those medium-term rates of revenue growth.
Comparing that to the industry, which is only predicted to deliver 6.4% growth in the next 12 months, the company's momentum is stronger based on recent medium-term annualised revenue results.
In light of this, it's peculiar that Simply Better Brands' P/S sits below the majority of other companies. It looks like most investors are not convinced the company can maintain its recent growth rates.
What Does Simply Better Brands' P/S Mean For Investors?
We'd say the price-to-sales ratio's power isn't primarily as a valuation instrument but rather to gauge current investor sentiment and future expectations.
Our examination of Simply Better Brands revealed its three-year revenue trends aren't boosting its P/S anywhere near as much as we would have predicted, given they look better than current industry expectations. Potential investors that are sceptical over continued revenue performance may be preventing the P/S ratio from matching previous strong performance. While recent revenue trends over the past medium-term suggest that the risk of a price decline is low, investors appear to perceive a likelihood of revenue fluctuations in the future.
Before you take the next step, you should know about the 3 warning signs for Simply Better Brands (2 are a bit unpleasant!) that we have uncovered.
If strong companies turning a profit tickle your fancy, then you'll want to check out this free list of interesting companies that trade on a low P/E (but have proven they can grow earnings).
Have feedback on this article? Concerned about the content? Get in touch with us directly. Alternatively, email editorial-team (at) simplywallst.com.
This article by Simply Wall St is general in nature. We provide commentary based on historical data and analyst forecasts only using an unbiased methodology and our articles are not intended to be financial advice. It does not constitute a recommendation to buy or sell any stock, and does not take account of your objectives, or your financial situation. We aim to bring you long-term focused analysis driven by fundamental data. Note that our analysis may not factor in the latest price-sensitive company announcements or qualitative material. Simply Wall St has no position in any stocks mentioned.
