
 Yahoo Finance
 A Sliding Share Price Has Us Looking At McCarthy & Stone plc's (LON:MCS) P/E Ratio

Unfortunately for some shareholders, the McCarthy & Stone (LON:MCS) share price has dived 31% in the last thirty days. Even longer term holders have taken a real hit with the stock declining 18% in the last year.
All else being equal, a share price drop should make a stock more attractive to potential investors. While the market sentiment towards a stock is very changeable, in the long run, the share price will tend to move in the same direction as earnings per share. The implication here is that long term investors have an opportunity when expectations of a company are too low. Perhaps the simplest way to get a read on investors' expectations of a business is to look at its Price to Earnings Ratio (PE Ratio). Investors have optimistic expectations of companies with higher P/E ratios, compared to companies with lower P/E ratios.
View our latest analysis for McCarthy & Stone
How Does McCarthy & Stone's P/E Ratio Compare To Its Peers?
We can tell from its P/E ratio of 19.29 that there is some investor optimism about McCarthy & Stone. The image below shows that McCarthy & Stone has a higher P/E than the average (9.3) P/E for companies in the consumer durables industry.
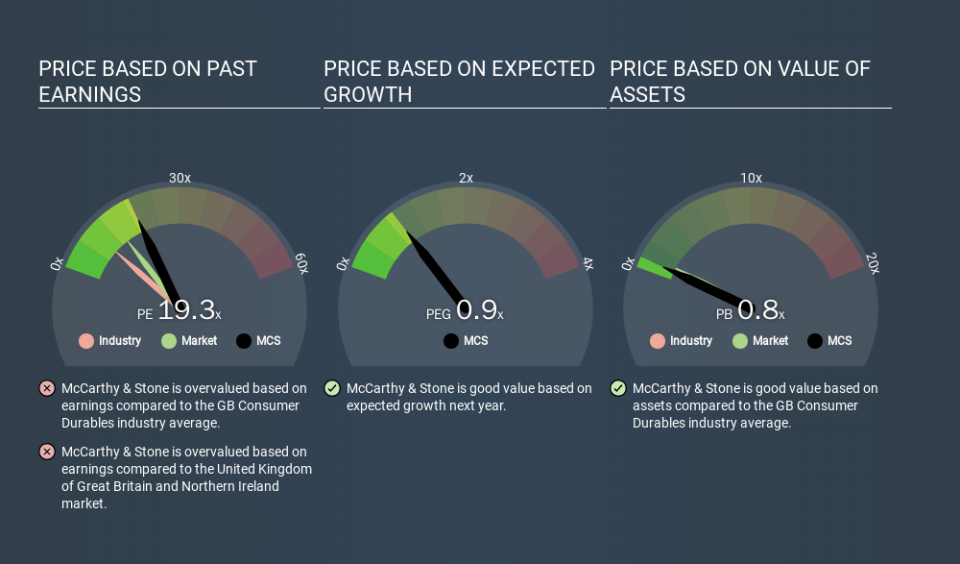
McCarthy & Stone's P/E tells us that market participants think the company will perform better than its industry peers, going forward. Shareholders are clearly optimistic, but the future is always uncertain. So investors should always consider the P/E ratio alongside other factors, such as whether company directors have been buying shares.
How Growth Rates Impact P/E Ratios
Companies that shrink earnings per share quickly will rapidly decrease the 'E' in the equation. Therefore, even if you pay a low multiple of earnings now, that multiple will become higher in the future. So while a stock may look cheap based on past earnings, it could be expensive based on future earnings.
McCarthy & Stone shrunk earnings per share by 32% over the last year. And over the longer term (5 years) earnings per share have decreased 12% annually. This growth rate might warrant a below average P/E ratio.
Remember: P/E Ratios Don't Consider The Balance Sheet
Don't forget that the P/E ratio considers market capitalization. Thus, the metric does not reflect cash or debt held by the company. Theoretically, a business can improve its earnings (and produce a lower P/E in the future) by investing in growth. That means taking on debt (or spending its cash).
While growth expenditure doesn't always pay off, the point is that it is a good option to have; but one that the P/E ratio ignores.
Is Debt Impacting McCarthy & Stone's P/E?
The extra options and safety that comes with McCarthy & Stone's UK£27m net cash position means that it deserves a higher P/E than it would if it had a lot of net debt.
The Bottom Line On McCarthy & Stone's P/E Ratio
McCarthy & Stone's P/E is 19.3 which is above average (13.9) in its market. The recent drop in earnings per share might keep value investors away, but the net cash position means the company has time to improve: and the high P/E suggests the market thinks it will. What can be absolutely certain is that the market has become significantly less optimistic about McCarthy & Stone over the last month, with the P/E ratio falling from 28.0 back then to 19.3 today. For those who don't like to trade against momentum, that could be a warning sign, but a contrarian investor might want to take a closer look.
When the market is wrong about a stock, it gives savvy investors an opportunity. If the reality for a company is better than it expects, you can make money by buying and holding for the long term. So this free visualization of the analyst consensus on future earnings could help you make the right decision about whether to buy, sell, or hold.
You might be able to find a better buy than McCarthy & Stone. If you want a selection of possible winners, check out this free list of interesting companies that trade on a P/E below 20 (but have proven they can grow earnings).
If you spot an error that warrants correction, please contact the editor at editorial-team@simplywallst.com. This article by Simply Wall St is general in nature. It does not constitute a recommendation to buy or sell any stock, and does not take account of your objectives, or your financial situation. Simply Wall St has no position in the stocks mentioned.
We aim to bring you long-term focused research analysis driven by fundamental data. Note that our analysis may not factor in the latest price-sensitive company announcements or qualitative material. Thank you for reading.
