
 Yahoo Finance
 A Sliding Share Price Has Us Looking At Williams-Sonoma, Inc.'s (NYSE:WSM) P/E Ratio

Unfortunately for some shareholders, the Williams-Sonoma (NYSE:WSM) share price has dived 39% in the last thirty days. Even longer term holders have taken a real hit with the stock declining 20% in the last year.
Assuming nothing else has changed, a lower share price makes a stock more attractive to potential buyers. In the long term, share prices tend to follow earnings per share, but in the short term prices bounce around in response to short term factors (which are not always obvious). So, on certain occasions, long term focussed investors try to take advantage of pessimistic expectations to buy shares at a better price. Perhaps the simplest way to get a read on investors' expectations of a business is to look at its Price to Earnings Ratio (PE Ratio). A high P/E implies that investors have high expectations of what a company can achieve compared to a company with a low P/E ratio.
Check out our latest analysis for Williams-Sonoma
Does Williams-Sonoma Have A Relatively High Or Low P/E For Its Industry?
Williams-Sonoma's P/E is 10.34. You can see in the image below that the average P/E (10.3) for companies in the specialty retail industry is roughly the same as Williams-Sonoma's P/E.
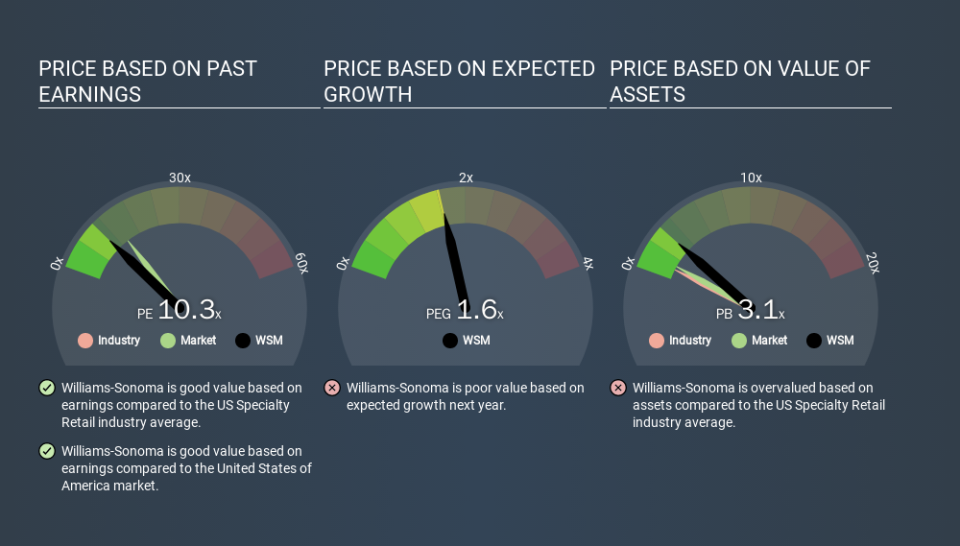
Williams-Sonoma's P/E tells us that market participants think its prospects are roughly in line with its industry. The company could surprise by performing better than average, in the future. I would further inform my view by checking insider buying and selling., among other things.
How Growth Rates Impact P/E Ratios
Earnings growth rates have a big influence on P/E ratios. When earnings grow, the 'E' increases, over time. That means even if the current P/E is high, it will reduce over time if the share price stays flat. So while a stock may look expensive based on past earnings, it could be cheap based on future earnings.
Notably, Williams-Sonoma grew EPS by a whopping 30% in the last year. And earnings per share have improved by 7.0% annually, over the last five years. I'd therefore be a little surprised if its P/E ratio was not relatively high.
Remember: P/E Ratios Don't Consider The Balance Sheet
Don't forget that the P/E ratio considers market capitalization. So it won't reflect the advantage of cash, or disadvantage of debt. Hypothetically, a company could reduce its future P/E ratio by spending its cash (or taking on debt) to achieve higher earnings.
Such expenditure might be good or bad, in the long term, but the point here is that the balance sheet is not reflected by this ratio.
So What Does Williams-Sonoma's Balance Sheet Tell Us?
Net debt totals just 7.0% of Williams-Sonoma's market cap. It would probably trade on a higher P/E ratio if it had a lot of cash, but I doubt it is having a big impact.
The Bottom Line On Williams-Sonoma's P/E Ratio
Williams-Sonoma's P/E is 10.3 which is below average (14.0) in the US market. The EPS growth last year was strong, and debt levels are quite reasonable. The low P/E ratio suggests current market expectations are muted, implying these levels of growth will not continue. What can be absolutely certain is that the market has become significantly less optimistic about Williams-Sonoma over the last month, with the P/E ratio falling from 16.9 back then to 10.3 today. For those who prefer to invest with the flow of momentum, that might be a bad sign, but for a contrarian, it may signal opportunity.
Investors have an opportunity when market expectations about a stock are wrong. If it is underestimating a company, investors can make money by buying and holding the shares until the market corrects itself. So this free visual report on analyst forecasts could hold the key to an excellent investment decision.
Of course you might be able to find a better stock than Williams-Sonoma. So you may wish to see this free collection of other companies that have grown earnings strongly.
If you spot an error that warrants correction, please contact the editor at editorial-team@simplywallst.com. This article by Simply Wall St is general in nature. It does not constitute a recommendation to buy or sell any stock, and does not take account of your objectives, or your financial situation. Simply Wall St has no position in the stocks mentioned.
We aim to bring you long-term focused research analysis driven by fundamental data. Note that our analysis may not factor in the latest price-sensitive company announcements or qualitative material. Thank you for reading.
