
 Yahoo Finance
 Slowing Rates Of Return At Consolidated Edison (NYSE:ED) Leave Little Room For Excitement
If you're looking for a multi-bagger, there's a few things to keep an eye out for. Amongst other things, we'll want to see two things; firstly, a growing return on capital employed (ROCE) and secondly, an expansion in the company's amount of capital employed. Basically this means that a company has profitable initiatives that it can continue to reinvest in, which is a trait of a compounding machine. However, after briefly looking over the numbers, we don't think Consolidated Edison (NYSE:ED) has the makings of a multi-bagger going forward, but let's have a look at why that may be.
Return On Capital Employed (ROCE): What Is It?
If you haven't worked with ROCE before, it measures the 'return' (pre-tax profit) a company generates from capital employed in its business. The formula for this calculation on Consolidated Edison is:
Return on Capital Employed = Earnings Before Interest and Tax (EBIT) ÷ (Total Assets - Current Liabilities)
0.051 = US$3.1b ÷ (US$66b - US$6.5b) (Based on the trailing twelve months to December 2023).
So, Consolidated Edison has an ROCE of 5.1%. On its own that's a low return on capital but it's in line with the industry's average returns of 4.9%.
Check out our latest analysis for Consolidated Edison
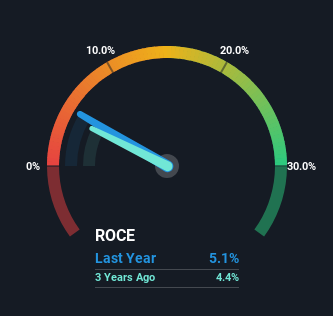
Above you can see how the current ROCE for Consolidated Edison compares to its prior returns on capital, but there's only so much you can tell from the past. If you're interested, you can view the analysts predictions in our free analyst report for Consolidated Edison .
What Can We Tell From Consolidated Edison's ROCE Trend?
The returns on capital haven't changed much for Consolidated Edison in recent years. Over the past five years, ROCE has remained relatively flat at around 5.1% and the business has deployed 25% more capital into its operations. Given the company has increased the amount of capital employed, it appears the investments that have been made simply don't provide a high return on capital.
In Conclusion...
As we've seen above, Consolidated Edison's returns on capital haven't increased but it is reinvesting in the business. And with the stock having returned a mere 36% in the last five years to shareholders, you could argue that they're aware of these lackluster trends. Therefore, if you're looking for a multi-bagger, we'd propose looking at other options.
Consolidated Edison does have some risks, we noticed 3 warning signs (and 1 which is significant) we think you should know about.
For those who like to invest in solid companies, check out this free list of companies with solid balance sheets and high returns on equity.
Have feedback on this article? Concerned about the content? Get in touch with us directly. Alternatively, email editorial-team (at) simplywallst.com.
This article by Simply Wall St is general in nature. We provide commentary based on historical data and analyst forecasts only using an unbiased methodology and our articles are not intended to be financial advice. It does not constitute a recommendation to buy or sell any stock, and does not take account of your objectives, or your financial situation. We aim to bring you long-term focused analysis driven by fundamental data. Note that our analysis may not factor in the latest price-sensitive company announcements or qualitative material. Simply Wall St has no position in any stocks mentioned.
