
 Yahoo Finance
 What Is SM Energy's (NYSE:SM) P/E Ratio After Its Share Price Rocketed?

SM Energy (NYSE:SM) shareholders are no doubt pleased to see that the share price has had a great month, posting a 31% gain, recovering from prior weakness. But shareholders may not all be feeling jubilant, since the share price is still down 29% in the last year.
Assuming no other changes, a sharply higher share price makes a stock less attractive to potential buyers. While the market sentiment towards a stock is very changeable, in the long run, the share price will tend to move in the same direction as earnings per share. So some would prefer to hold off buying when there is a lot of optimism towards a stock. One way to gauge market expectations of a stock is to look at its Price to Earnings Ratio (PE Ratio). Investors have optimistic expectations of companies with higher P/E ratios, compared to companies with lower P/E ratios.
See our latest analysis for SM Energy
How Does SM Energy's P/E Ratio Compare To Its Peers?
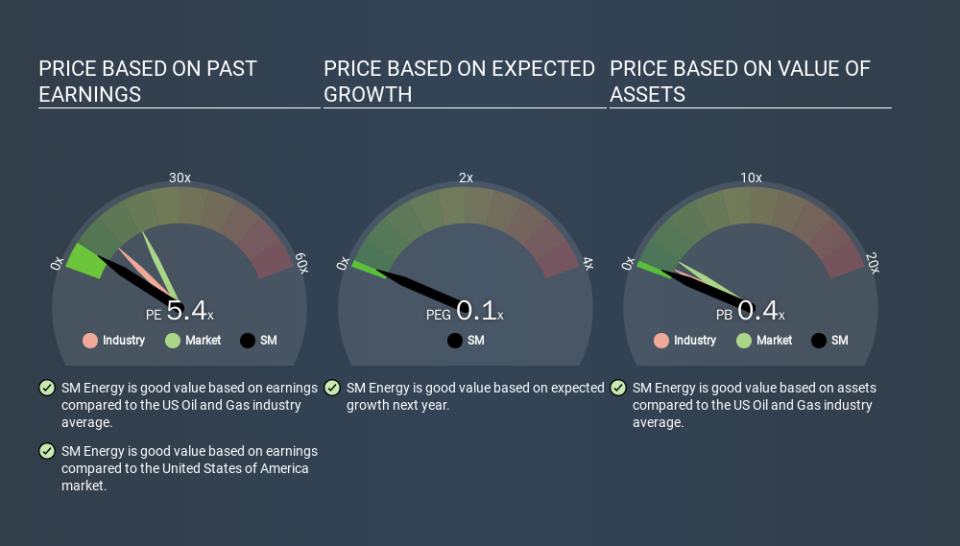
SM Energy's P/E of 5.44 indicates relatively low sentiment towards the stock. We can see in the image below that the average P/E (10.5) for companies in the oil and gas industry is higher than SM Energy's P/E.
SM Energy's P/E tells us that market participants think it will not fare as well as its peers in the same industry. While current expectations are low, the stock could be undervalued if the situation is better than the market assumes. If you consider the stock interesting, further research is recommended. For example, I often monitor director buying and selling.
How Growth Rates Impact P/E Ratios
Earnings growth rates have a big influence on P/E ratios. Earnings growth means that in the future the 'E' will be higher. Therefore, even if you pay a high multiple of earnings now, that multiple will become lower in the future. A lower P/E should indicate the stock is cheap relative to others -- and that may attract buyers.
Notably, SM Energy grew EPS by a whopping 30% in the last year. In contrast, EPS has decreased by 17%, annually, over 5 years.
A Limitation: P/E Ratios Ignore Debt and Cash In The Bank
One drawback of using a P/E ratio is that it considers market capitalization, but not the balance sheet. So it won't reflect the advantage of cash, or disadvantage of debt. Hypothetically, a company could reduce its future P/E ratio by spending its cash (or taking on debt) to achieve higher earnings.
Such spending might be good or bad, overall, but the key point here is that you need to look at debt to understand the P/E ratio in context.
SM Energy's Balance Sheet
SM Energy's net debt is considerable, at 223% of its market cap. This level of debt justifies a relatively low P/E, so remain cognizant of the debt, if you're comparing it to other stocks.
The Bottom Line On SM Energy's P/E Ratio
SM Energy trades on a P/E ratio of 5.4, which is below the US market average of 18.9. The company has a meaningful amount of debt on the balance sheet, but that should not eclipse the solid earnings growth. The low P/E ratio suggests current market expectations are muted, implying these levels of growth will not continue. What is very clear is that the market has become less pessimistic about SM Energy over the last month, with the P/E ratio rising from 4.2 back then to 5.4 today. For those who like to invest in turnarounds, that might mean it's time to put the stock on a watchlist, or research it. But others might consider the opportunity to have passed.
Investors should be looking to buy stocks that the market is wrong about. As value investor Benjamin Graham famously said, 'In the short run, the market is a voting machine but in the long run, it is a weighing machine. So this free visual report on analyst forecasts could hold the key to an excellent investment decision.
You might be able to find a better buy than SM Energy. If you want a selection of possible winners, check out this free list of interesting companies that trade on a P/E below 20 (but have proven they can grow earnings).
If you spot an error that warrants correction, please contact the editor at editorial-team@simplywallst.com. This article by Simply Wall St is general in nature. It does not constitute a recommendation to buy or sell any stock, and does not take account of your objectives, or your financial situation. Simply Wall St has no position in the stocks mentioned.
We aim to bring you long-term focused research analysis driven by fundamental data. Note that our analysis may not factor in the latest price-sensitive company announcements or qualitative material. Thank you for reading.
