
 Yahoo Finance
 Smart Sand (NASDAQ:SND) Could Be At Risk Of Shrinking As A Company
If you're looking at a mature business that's past the growth phase, what are some of the underlying trends that pop up? When we see a declining return on capital employed (ROCE) in conjunction with a declining base of capital employed, that's often how a mature business shows signs of aging. This indicates the company is producing less profit from its investments and its total assets are decreasing. So after we looked into Smart Sand (NASDAQ:SND), the trends above didn't look too great.
Return On Capital Employed (ROCE): What Is It?
Just to clarify if you're unsure, ROCE is a metric for evaluating how much pre-tax income (in percentage terms) a company earns on the capital invested in its business. Analysts use this formula to calculate it for Smart Sand:
Return on Capital Employed = Earnings Before Interest and Tax (EBIT) ÷ (Total Assets - Current Liabilities)
0.0028 = US$804k ÷ (US$349m - US$59m) (Based on the trailing twelve months to March 2024).
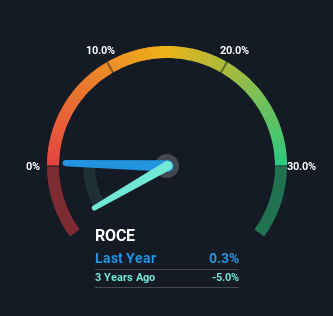
Therefore, Smart Sand has an ROCE of 0.3%. Ultimately, that's a low return and it under-performs the Energy Services industry average of 12%.
See our latest analysis for Smart Sand
Above you can see how the current ROCE for Smart Sand compares to its prior returns on capital, but there's only so much you can tell from the past. If you'd like to see what analysts are forecasting going forward, you should check out our free analyst report for Smart Sand .
So How Is Smart Sand's ROCE Trending?
We are a bit worried about the trend of returns on capital at Smart Sand. About five years ago, returns on capital were 14%, however they're now substantially lower than that as we saw above. Meanwhile, capital employed in the business has stayed roughly the flat over the period. Companies that exhibit these attributes tend to not be shrinking, but they can be mature and facing pressure on their margins from competition. So because these trends aren't typically conducive to creating a multi-bagger, we wouldn't hold our breath on Smart Sand becoming one if things continue as they have.
The Bottom Line On Smart Sand's ROCE
In the end, the trend of lower returns on the same amount of capital isn't typically an indication that we're looking at a growth stock. Long term shareholders who've owned the stock over the last five years have experienced a 19% depreciation in their investment, so it appears the market might not like these trends either. Unless there is a shift to a more positive trajectory in these metrics, we would look elsewhere.
If you'd like to know more about Smart Sand, we've spotted 4 warning signs, and 1 of them is a bit unpleasant.
If you want to search for solid companies with great earnings, check out this free list of companies with good balance sheets and impressive returns on equity.
Have feedback on this article? Concerned about the content? Get in touch with us directly. Alternatively, email editorial-team (at) simplywallst.com.
This article by Simply Wall St is general in nature. We provide commentary based on historical data and analyst forecasts only using an unbiased methodology and our articles are not intended to be financial advice. It does not constitute a recommendation to buy or sell any stock, and does not take account of your objectives, or your financial situation. We aim to bring you long-term focused analysis driven by fundamental data. Note that our analysis may not factor in the latest price-sensitive company announcements or qualitative material. Simply Wall St has no position in any stocks mentioned.
Have feedback on this article? Concerned about the content? Get in touch with us directly. Alternatively, email editorial-team@simplywallst.com
