
 Yahoo Finance
 SolarEdge Technologies' (NASDAQ:SEDG) Returns On Capital Not Reflecting Well On The Business
If you're not sure where to start when looking for the next multi-bagger, there are a few key trends you should keep an eye out for. Firstly, we'll want to see a proven return on capital employed (ROCE) that is increasing, and secondly, an expanding base of capital employed. Basically this means that a company has profitable initiatives that it can continue to reinvest in, which is a trait of a compounding machine. In light of that, when we looked at SolarEdge Technologies (NASDAQ:SEDG) and its ROCE trend, we weren't exactly thrilled.
Understanding Return On Capital Employed (ROCE)
Just to clarify if you're unsure, ROCE is a metric for evaluating how much pre-tax income (in percentage terms) a company earns on the capital invested in its business. The formula for this calculation on SolarEdge Technologies is:
Return on Capital Employed = Earnings Before Interest and Tax (EBIT) ÷ (Total Assets - Current Liabilities)
0.084 = US$283m ÷ (US$4.3b - US$890m) (Based on the trailing twelve months to December 2022).
Thus, SolarEdge Technologies has an ROCE of 8.4%. Ultimately, that's a low return and it under-performs the Semiconductor industry average of 14%.
See our latest analysis for SolarEdge Technologies
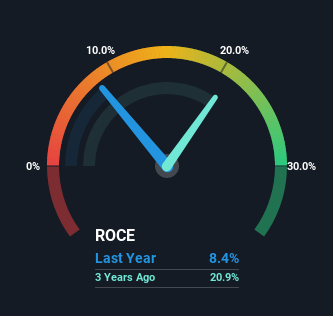
Above you can see how the current ROCE for SolarEdge Technologies compares to its prior returns on capital, but there's only so much you can tell from the past. If you're interested, you can view the analysts predictions in our free report on analyst forecasts for the company.
What The Trend Of ROCE Can Tell Us
In terms of SolarEdge Technologies' historical ROCE movements, the trend isn't fantastic. Over the last five years, returns on capital have decreased to 8.4% from 18% five years ago. Although, given both revenue and the amount of assets employed in the business have increased, it could suggest the company is investing in growth, and the extra capital has led to a short-term reduction in ROCE. And if the increased capital generates additional returns, the business, and thus shareholders, will benefit in the long run.
What We Can Learn From SolarEdge Technologies' ROCE
In summary, despite lower returns in the short term, we're encouraged to see that SolarEdge Technologies is reinvesting for growth and has higher sales as a result. And the stock has done incredibly well with a 426% return over the last five years, so long term investors are no doubt ecstatic with that result. So while investors seem to be recognizing these promising trends, we would look further into this stock to make sure the other metrics justify the positive view.
If you'd like to know about the risks facing SolarEdge Technologies, we've discovered 2 warning signs that you should be aware of.
If you want to search for solid companies with great earnings, check out this free list of companies with good balance sheets and impressive returns on equity.
Have feedback on this article? Concerned about the content? Get in touch with us directly. Alternatively, email editorial-team (at) simplywallst.com.
This article by Simply Wall St is general in nature. We provide commentary based on historical data and analyst forecasts only using an unbiased methodology and our articles are not intended to be financial advice. It does not constitute a recommendation to buy or sell any stock, and does not take account of your objectives, or your financial situation. We aim to bring you long-term focused analysis driven by fundamental data. Note that our analysis may not factor in the latest price-sensitive company announcements or qualitative material. Simply Wall St has no position in any stocks mentioned.
Join A Paid User Research Session
You’ll receive a US$30 Amazon Gift card for 1 hour of your time while helping us build better investing tools for the individual investors like yourself. Sign up here
